HOT TOPICS LIST
- MACD
- Fibonacci
- RSI
- Gann
- ADXR
- Stochastics
- Volume
- Triangles
- Futures
- Cycles
- Volatility
- ZIGZAG
- MESA
- Retracement
- Aroon
INDICATORS LIST
LIST OF TOPICS
PRINT THIS ARTICLE
by Koos van der Merwe
The DJIA is down, so why has PMC-Sierra given me a buy signal?
Position: Buy
Koos van der Merwe
Has been a technical analyst since 1969, and has worked as a futures and options trader with First Financial Futures in Johannesburg, South Africa.
PRINT THIS ARTICLE
HEAD & SHOULDERS
PMC-Sierra
01/21/10 08:12:20 AMby Koos van der Merwe
The DJIA is down, so why has PMC-Sierra given me a buy signal?
Position: Buy
| PMC-Sierra, a leading provider of broadband communications and storage semiconductors and offers worldwide technical and sales support, including a network of offices throughout most of the world. PMC-Sierra's fourth-quarter 2009 earnings will be released after the stock market closes on January 28, 2010. Is this the reason why I have gotten a buy signal? |

|
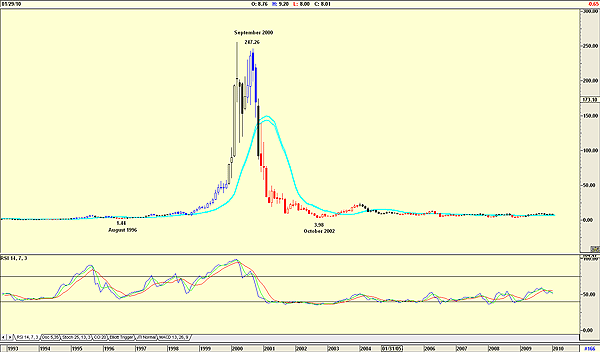
| FIGURE 1: PMCS, MONTHLY |
| Graphic provided by: AdvancedGET. |
| |
| Figure 1 is a monthly chart and shows how public enthusiasm at the time of the dotcom bubble pushed the share price from a low of $1.44 in August 1996 to a high of $247.26 by September 2000 — incredible for those who owned the stock. Note how the relative strength index (RSI) warned of the impending crash. |

|
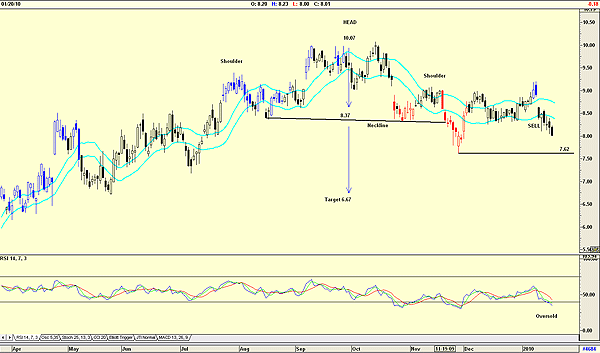
| FIGURE 2: PMCS, DAILY |
| Graphic provided by: AdvancedGET. |
| |
| Figure 2 suggests a head & shoulders pattern and shows that the neckline has been penetrated, but the target of $6.67 has not yet been reached. The chart shows a JM inside band sell signal. A JM inside band is a 15-period simple moving average (SMA) offset by 2% positive and 2% negative. There is resistance at the pivot point 7.62. |

|
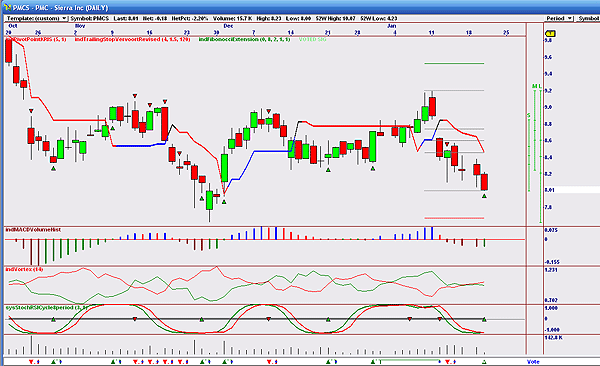
| FIGURE 3: PMCS DAILY, OMNITRADER |
| Graphic provided by: Omnitrader. |
| |
| Figure 3 is an OmniTrader chart of PMC-Sierra and is the chart that has given me the buy signal. This chart shows the following: 1. A candlestick chart with a trailing stop and Fibonacci support levels. The price is below the trailing stop level but is testing the Fibonacci support level at $8.01. 2. The MACD volume indicator has given a buy signal. 3. The vortex indicator written about in the January 2010 issue of STOCKS & COMMODITIES suggests further weakness. 4. The stochastic RSI cycle 8 period indicator has given a buy signal. 5. Finally, the vote line, which has given a buy signal with a backtest hit ratio of 100 (not shown). To conclude, the stock has given a buy signal ahead of its financial report, and it is a strong one despite the head & shoulder pattern not yet reaching its target. With the Dow Jones Industrial Average down, we could put in a low ball bid. This is a stock that should be watched. |
Has been a technical analyst since 1969, and has worked as a futures and options trader with First Financial Futures in Johannesburg, South Africa.
| Address: | 3256 West 24th Ave |
| Vancouver, BC | |
| Phone # for sales: | 6042634214 |
| E-mail address: | petroosp@gmail.com |
Click here for more information about our publications!
Comments
Date: 01/22/10Rank: 5Comment:
Date: 01/28/10Rank: 5Comment: Koos:
Good show!
Dick

Request Information From Our Sponsors
- StockCharts.com, Inc.
- Candle Patterns
- Candlestick Charting Explained
- Intermarket Technical Analysis
- John Murphy on Chart Analysis
- John Murphy's Chart Pattern Recognition
- John Murphy's Market Message
- MurphyExplainsMarketAnalysis-Intermarket Analysis
- MurphyExplainsMarketAnalysis-Visual Analysis
- StockCharts.com
- Technical Analysis of the Financial Markets
- The Visual Investor
- VectorVest, Inc.
- Executive Premier Workshop
- One-Day Options Course
- OptionsPro
- Retirement Income Workshop
- Sure-Fire Trading Systems (VectorVest, Inc.)
- Trading as a Business Workshop
- VectorVest 7 EOD
- VectorVest 7 RealTime/IntraDay
- VectorVest AutoTester
- VectorVest Educational Services
- VectorVest OnLine
- VectorVest Options Analyzer
- VectorVest ProGraphics v6.0
- VectorVest ProTrader 7
- VectorVest RealTime Derby Tool
- VectorVest Simulator
- VectorVest Variator
- VectorVest Watchdog
