HOT TOPICS LIST
- MACD
- Fibonacci
- RSI
- Gann
- ADXR
- Stochastics
- Volume
- Triangles
- Futures
- Cycles
- Volatility
- ZIGZAG
- MESA
- Retracement
- Aroon
INDICATORS LIST
LIST OF TOPICS
PRINT THIS ARTICLE
by Alan R. Northam
The Semiconductor HOLDRS exchange traded fund is considered a leading indicator of the stock market and the economy. By determining the trend of this ETF, a prediction about the future of the stock market and the economy can be determined.
Position: N/A
Alan R. Northam
Alan Northam lives in the Dallas, Texas area and as an electronic engineer gave him an analytical mind from which he has developed a thorough knowledge of stock market technical analysis. His abilities to analyze the future direction of the stock market has allowed him to successfully trade of his own portfolio over the last 30 years. Mr. Northam is now retired and trading the stock market full time. You can reach him at inquiry@tradersclassroom.com or by visiting his website at http://www.tradersclassroom.com. You can also follow him on Twitter @TradersClassrm.
PRINT THIS ARTICLE
ANDREWS PITCH-FORK
Semiconductors Reverse Trend
01/19/10 09:08:42 AMby Alan R. Northam
The Semiconductor HOLDRS exchange traded fund is considered a leading indicator of the stock market and the economy. By determining the trend of this ETF, a prediction about the future of the stock market and the economy can be determined.
Position: N/A
| Electronics are a major consumer item in this day and time. Consumers are buying televisions, computers, cell phones, and all sorts of other electronic devices. Consumer spending accounts for more than two-thirds of the economy. Therefore, by monitoring the consumer spending in electronic devices, we can get a good idea of the health of our economy. One way of doing this is by monitoring the stocks of companies that are providing the electronic chips that go into these electronic devices. The Semiconductor Holders exchange traded fund (ETF)(SMH) contains a number of stocks of companies that manufacture electronic chips, of which Intel is the largest holding. By performing a technical analysis of the price trend of SMH, it then becomes possible to obtain a perspective of the economy and the future of the stock market. |
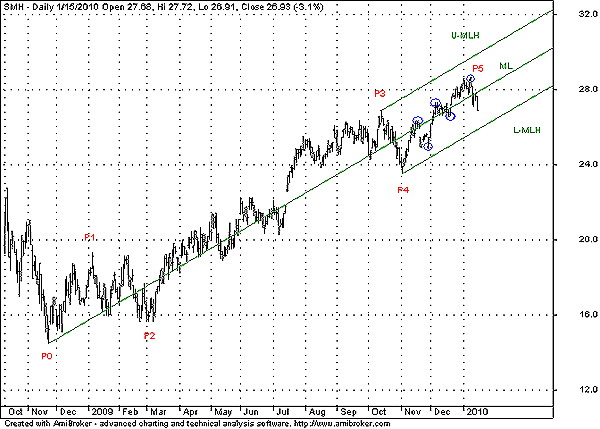
| To perform our analysis, we will use the Andrews pitchfork. The first thing Alan Hall Andrews did when he picked up a price chart was to identify as many significant pivot points as he could. I identified five significant pivot points in Figure 1. After finding the first four significant pivot points, Andrews would then look for five alternating high and low closes to find the fifth significant pivot point. I have shown five alternating high and low closes as blue circles and as a result identified the fifth significant pivot point as P5, according to Andrews' methods. Upon identifying five significant pivot points, Andrews noted that more often than not a trend reversal would follow. Having identified five significant pivot points in Figure 1, we can now expect a trend reversal. |

|
| FIGURE 1: SMH, DAILY. This chart shows the Andrews pitchfork. |
| Graphic provided by: AmiBroker.com. |
| |
| Once the first four pivot points were identified, Andrews would draw a pitchfork from P0 to P3 and P4 as shown in Figure 1. The median line of the pitchfork (ML) is drawn from P0 and passes through the midpoint between P3 and P4. Andrews noted that the median line was like a magnet and drew price to it. This can be seen in Figure 1, as price was drawn to it after reversing at pivot point P4 and price has stuck to the median line since. Andrews identified the line above the median line as a horizontal line and labels it as U-MLH for upper median line horizontal. The line below the median line is labeled L-MLH, which stands for lower median line horizontal. After P5 was identified, Andrews expected price to drop down below the L-MLH. |
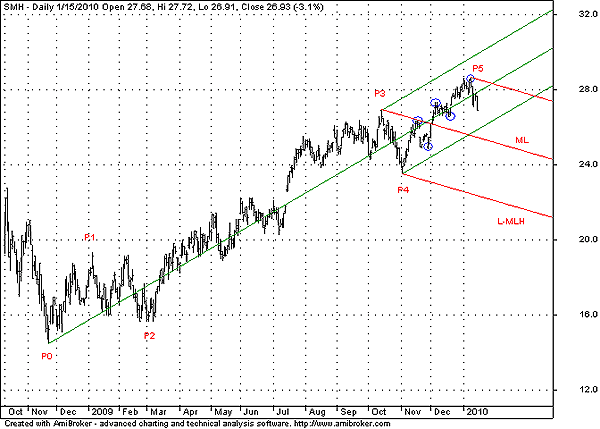
| Whenever a new pivot point was identified, Andrews would draw a new pitchfork off the last three significant pivot points as I have done in Figure 2. Andrews would then look for price to move down to the median line of this new pitchfork. Andrews also knew that 80% of the time, price would reverse directions upon reaching the median line. Since the uptrend has now formed five significant pivot points and a trend reversal is expected, price should now move down to the new pitchfork drawn off the last three significant pivot points and then reverse back upward. However, if price continues down through the median line of the red pitchfork, Andrews then expected price to continue lower to the lower line drawn horizontal to the median line labeled L_MLH before reversing back up. A breakdown below the L-MLH would indicate an larger drop in price. |

|
| FIGURE 2: TWO PITCHFORKS. The red pitchfork shows the expected direction of the current market trend. Price will move down 80% of the time to the median line (ML) and then reverse back upward. |
| Graphic provided by: AmiBroker.com. |
| |
| In conclusion, SMH looks to have completed its uptrend and is now reversing to the downside. SMH is now expected to trade down to the median line of the red pitchfork and then reverse back upward to start a new uptrend. However, a move below the median line would signal a deeper correction or even the beginning of a new bear market downtrend, indicating trouble for the economy. |
Alan Northam lives in the Dallas, Texas area and as an electronic engineer gave him an analytical mind from which he has developed a thorough knowledge of stock market technical analysis. His abilities to analyze the future direction of the stock market has allowed him to successfully trade of his own portfolio over the last 30 years. Mr. Northam is now retired and trading the stock market full time. You can reach him at inquiry@tradersclassroom.com or by visiting his website at http://www.tradersclassroom.com. You can also follow him on Twitter @TradersClassrm.
| Garland, Tx | |
| Website: | www.tradersclassroom.com |
| E-mail address: | inquiry@tradersclassroom.com |
Click here for more information about our publications!
Comments
Date: 01/20/10Rank: 3Comment:

Request Information From Our Sponsors
- StockCharts.com, Inc.
- Candle Patterns
- Candlestick Charting Explained
- Intermarket Technical Analysis
- John Murphy on Chart Analysis
- John Murphy's Chart Pattern Recognition
- John Murphy's Market Message
- MurphyExplainsMarketAnalysis-Intermarket Analysis
- MurphyExplainsMarketAnalysis-Visual Analysis
- StockCharts.com
- Technical Analysis of the Financial Markets
- The Visual Investor
- VectorVest, Inc.
- Executive Premier Workshop
- One-Day Options Course
- OptionsPro
- Retirement Income Workshop
- Sure-Fire Trading Systems (VectorVest, Inc.)
- Trading as a Business Workshop
- VectorVest 7 EOD
- VectorVest 7 RealTime/IntraDay
- VectorVest AutoTester
- VectorVest Educational Services
- VectorVest OnLine
- VectorVest Options Analyzer
- VectorVest ProGraphics v6.0
- VectorVest ProTrader 7
- VectorVest RealTime Derby Tool
- VectorVest Simulator
- VectorVest Variator
- VectorVest Watchdog
