HOT TOPICS LIST
- MACD
- Fibonacci
- RSI
- Gann
- ADXR
- Stochastics
- Volume
- Triangles
- Futures
- Cycles
- Volatility
- ZIGZAG
- MESA
- Retracement
- Aroon
INDICATORS LIST
LIST OF TOPICS
PRINT THIS ARTICLE
by Ron Walker
The A/D line is an effective gauge in determining the overall strength of the stock market. It is by far the most commonly used measure of market breadth.
Position: N/A
Ron Walker
Ron Walker is an active trader and technical analyst. He operates an educational website dedicated to the study of Technical Analysis. The website offers free market analysis with daily video presentations and written commentaries. Ron is a video pioneer, being one of the first to utilize the internet producing Technical Analysis videos. His website is thechartpatterntrader.com
PRINT THIS ARTICLE
A/D LINE
A Head And Shoulders Top On The NASDAQ A/D Line?
01/19/10 10:10:30 AMby Ron Walker
The A/D line is an effective gauge in determining the overall strength of the stock market. It is by far the most commonly used measure of market breadth.
Position: N/A
| The NASDAQ's advance/decline (A/D) line is the difference between the total number of advancing and declining issues on all the securities that make up the NASDAQ Composite ($COMPQ). If there are more advancing issues than declining ones, the A/D line reading for that day would be positive, and vice versa. The information, either positive or negative, is then added to the cumulative total, which we refer to as the A/D line. If advancers are outpacing decliners, the A/D line will rise and begin to trend higher. If declining issues prevail, the A/D line will decline and trend lower. The A/D line is useful because it forms trends and divergences. Sometimes the A/D trendline will break prior to a trend break on the NASDAQ. However, it is very common that their trendlines break simultaneously, thereby validating one another. When the NASDAQ and the A/D line diverge, it forewarns of an impending reversal. Market breadth is considered healthy when the A/D line and the NASDAQ move in the same direction. |

|
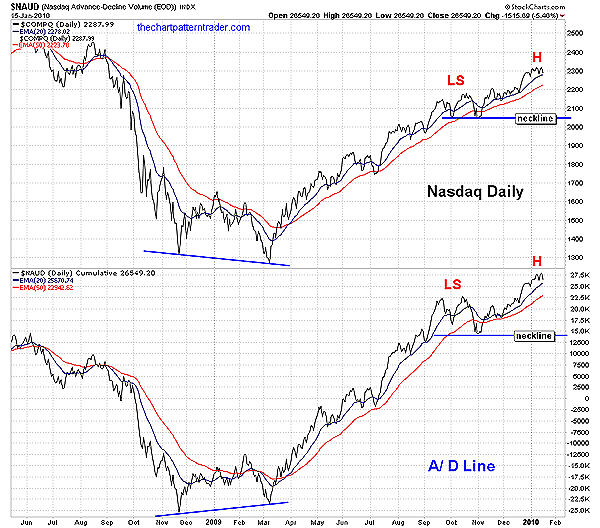
| FIGURE 1: NASDAQ, A/D LINE, DAILY. After a bullish divergence completed in March 2009, after a robust advance, a head & shoulders top could be carving out on both the NASDAQ and the A/D line. |
| Graphic provided by: StockCharts.com. |
| |
| Note the divergence that appeared between the NASDAQ A/D line and the NASDAQ in late 2008 to early 2009 (Figure 1). The NASDAQ moved to a lower low in March 2009, but the A/D line failed to make lower lows, meaning that the advancing issues are increasing. As a result, the NASDAQ bottomed out that March. That same month, the A/D line pushed above its 50-day exponential moving average (EMA) and has been advancing ever since, save for a temporary breach in late October to early November 2009. In addition to trends and divergences, the A/D line can also form chart patterns. In September and October, the A/D line began to carve out what appeared to be at the time a double-top pattern, with two individual peaks made during those months. But with the runup during November 2009 to January 2010, the A/D line is beginning to resemble the appearance of a head & shoulders top (see Figure 1). |

|
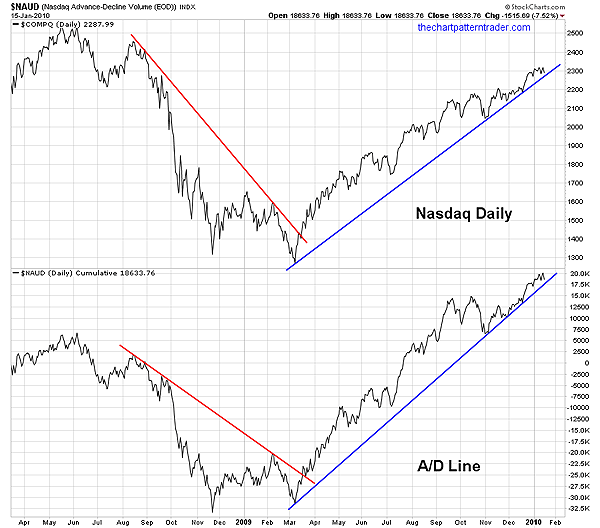
| FIGURE 2: NASDAQ, A/D LINE, DAILY. Here we see both the NASDAQ and the NASDAQ A/D line have mature trends. If the NASDAQ breaks its trendline, the A/D line must validate the move. |
| Graphic provided by: StockCharts.com. |
| |
| Figure 2 shows both the A/D line and the NASDAQ have mature trends. After they moved to new highs, the indexes gravitated back toward the trendlines that originated from March 2009 lows. If those trendlines break, it could allow the head & shoulders patterns seen in Figure 1 to complete. |

|
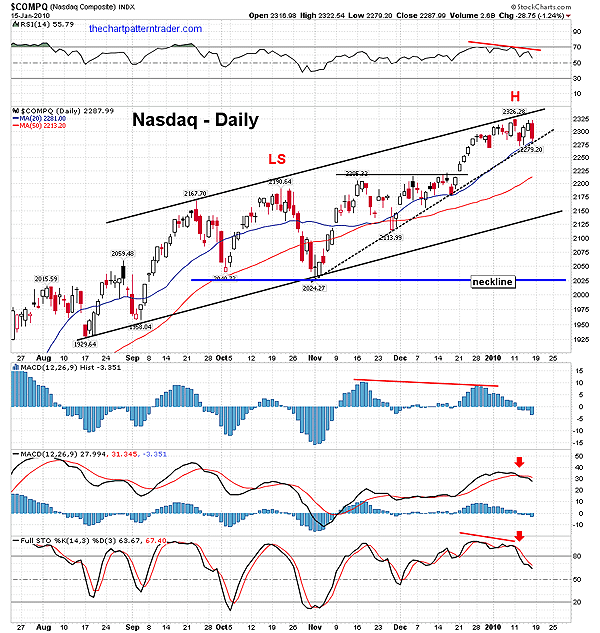
| FIGURE 3: NASDAQ, DAILY. The NASDAQ reversed off its upper channel line, testing the accelerated trendline. That formed a bearish rising wedge. A break in the accelerated trend may allow the lower channel line and potential neckline to be tested. |
| Graphic provided by: StockCharts.com. |
| |
| Chart patterns are psychological maps of human behavior. Euphoria has pushed both the A/D line and the NASDAQ to new highs to form their respective heads. If this current run dissipates and breaks the rising trendlines in Figure 2, causing the A/D line and NASDAQ to fall back to their necklines of support marked in Figure 1, that would complete the head formations. Should both develop a right shoulder after that, the top reversal patterns will be complete. If both the NASDAQ and the A/D line complete a right shoulder and form a lower high, they will validate each other and confirm a reversal. Further, if the A/D line also falls below the 50-day EMA as it grinds through a head & shoulders formation, it will reinforce the reversal patterns. |
| Now take a look at the NASDAQ ($COMPQ) daily chart in Figure 3. The NASDAQ moved to a new reaction high in early January 2010, reversing off the upper boundary of the trend channel. If prices continue to display weakness, we could see the trendlines in Figure 2 break and the head & shoulders patterns in Figure 1 play out. In Figure 3, after peaking at the upper boundary of the channel, prices fell back to the accelerated trendline to complete a bearish rising wedge pattern. If the accelerated trendline breaks, $COMPQ will fall to the corresponding lower channel line. Should prices penetrate that level, they could fall back to the neckline near the 2025 area, which was highlighted in Figure 1. If the head completely forms, it means that $COMPQ will fall by approximately 300 points from its recent peak, and break the lower channel line. |
Ron Walker is an active trader and technical analyst. He operates an educational website dedicated to the study of Technical Analysis. The website offers free market analysis with daily video presentations and written commentaries. Ron is a video pioneer, being one of the first to utilize the internet producing Technical Analysis videos. His website is thechartpatterntrader.com
| Website: | thechartpatterntrader.com |
| E-mail address: | thechartpatterntrader@gmail.com |
Click here for more information about our publications!
Comments
Date: 01/20/10Rank: 4Comment:
Date: 01/28/10Rank: 5Comment:

Request Information From Our Sponsors
- StockCharts.com, Inc.
- Candle Patterns
- Candlestick Charting Explained
- Intermarket Technical Analysis
- John Murphy on Chart Analysis
- John Murphy's Chart Pattern Recognition
- John Murphy's Market Message
- MurphyExplainsMarketAnalysis-Intermarket Analysis
- MurphyExplainsMarketAnalysis-Visual Analysis
- StockCharts.com
- Technical Analysis of the Financial Markets
- The Visual Investor
- VectorVest, Inc.
- Executive Premier Workshop
- One-Day Options Course
- OptionsPro
- Retirement Income Workshop
- Sure-Fire Trading Systems (VectorVest, Inc.)
- Trading as a Business Workshop
- VectorVest 7 EOD
- VectorVest 7 RealTime/IntraDay
- VectorVest AutoTester
- VectorVest Educational Services
- VectorVest OnLine
- VectorVest Options Analyzer
- VectorVest ProGraphics v6.0
- VectorVest ProTrader 7
- VectorVest RealTime Derby Tool
- VectorVest Simulator
- VectorVest Variator
- VectorVest Watchdog
