HOT TOPICS LIST
- MACD
- Fibonacci
- RSI
- Gann
- ADXR
- Stochastics
- Volume
- Triangles
- Futures
- Cycles
- Volatility
- ZIGZAG
- MESA
- Retracement
- Aroon
INDICATORS LIST
LIST OF TOPICS
PRINT THIS ARTICLE
by Alan R. Northam
The dollar has been in a downward trend since last March. However, in early November 2009, the dollar broke out above its downward sloping trendline. Once a trendline is broken the question becomes, "Has the market under study reversed its trend?" To answer this question, it is important to pay attention to what the market does following the breakout.
Position: N/A
Alan R. Northam
Alan Northam lives in the Dallas, Texas area and as an electronic engineer gave him an analytical mind from which he has developed a thorough knowledge of stock market technical analysis. His abilities to analyze the future direction of the stock market has allowed him to successfully trade of his own portfolio over the last 30 years. Mr. Northam is now retired and trading the stock market full time. You can reach him at inquiry@tradersclassroom.com or by visiting his website at http://www.tradersclassroom.com. You can also follow him on Twitter @TradersClassrm.
PRINT THIS ARTICLE
TECHNICAL ANALYSIS
Dollar, Up Or Down?
01/15/10 09:19:27 AMby Alan R. Northam
The dollar has been in a downward trend since last March. However, in early November 2009, the dollar broke out above its downward sloping trendline. Once a trendline is broken the question becomes, "Has the market under study reversed its trend?" To answer this question, it is important to pay attention to what the market does following the breakout.
Position: N/A
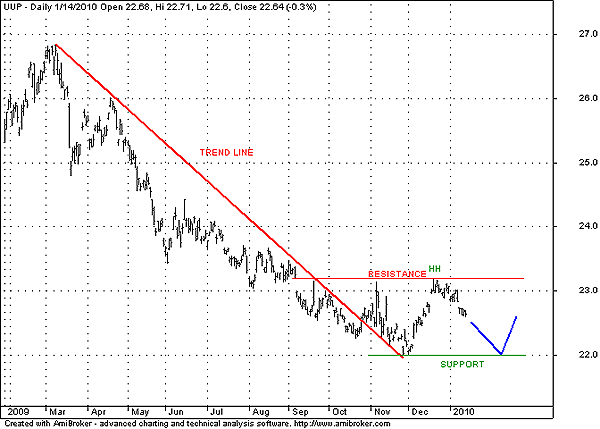
| Looking at the price chart of the US dollar exchange traded fund (ETF)(UUP) in Figure 1, the dollar broke out above the downsloping trendline that has been in effect since March 2009. The breakout above the trendline signals the end of the downtrend. The question now is, "Has the dollar reversed trends from down to up?" To answer this question, we must examine the technical situation. |

|
| FIGURE 1: UUP, DAILY. Here's a possible trading range developing and signaling a continuation of the downtrend. |
| Graphic provided by: AmiBroker.com. |
| |
| The first thing I noticed when looking at the price chart is the gap formed in early September. I also saw that price has formed three peaks since the gap, none of which have moved above the gap. Therefore, this represents a strong line of resistance and a resistance line is drawn. Price is now moving in a downward direction. I have also drawn a line of support off the market low, as this is the lowest level that price attained in the current downward rally off the March high. |
| In downtrends, support levels are easily broken and resistance lines are respected. This can easily be seen in Figure 1 by looking at each lower low and lower high made during the downtrend from March. Each lower low represents a line of support that has eventually been broken, while each lower high represents a line of resistance that has not been broken. So on the one hand the downsloping trendline has been broken indicating a reversal in trend is occurring, while on the other hand the lower highs, which represent lines of resistance, continues to hold, signaling that a downtrend remains intact. |
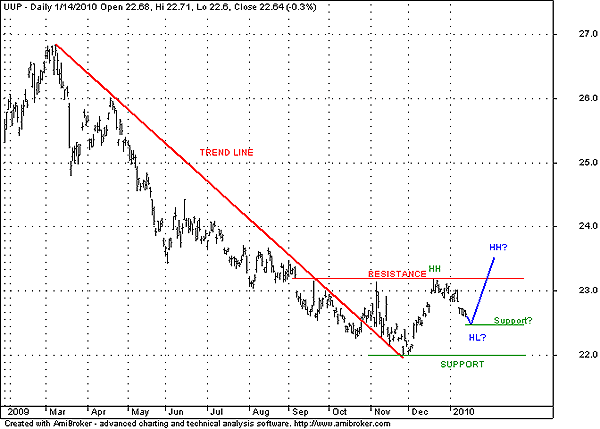
| To determine if the dollar is reversing its trend from down to up, further price action is needed. Currently, price is moving in the downward direction. If price moves down to the support line and reverses back up, a strong line of support will have developed. We say a "strong line of support" because two touches of a support line is stronger than a single one, and three touches would represent an even stronger line of support. If price makes it down to the support line and reverses back upward, the market will have formed a strong line of support and a strong line of resistance. These strong lines of support and resistance will most likely indicate that the dollar is trapped in a trading range. The characteristic of trading ranges is that they are trend continuation patterns and would then call for a continuation of the downtrend. In Figure 2, I offered an alternative analysis. It is possible for price to turn back upward before reaching the support line. If this occurs, a higher low price point will have developed, forming a new higher level of support. Further, if price then moves above the resistance line, this will be the first time a line of resistance has been broken since the downward rally in March began. An upward trend is indicated when support levels are held and resistance levels are broken. Therefore, the breaking of the resistance line will indicate that a new uptrend has started and will continue as long as each new level of support continues to hold. |

|
| FIGURE 2: UUP, DAILY. Here's a possible reversal in trend developing. |
| Graphic provided by: AmiBroker.com. |
| |
| In conclusion, it is not yet clear if the US dollar ETF has reversed to the upside or will continue to move lower. To answer this question, we need to wait on the market to either develop a continuation pattern or a new higher level of support that is not broken and a breakout above resistance to signal that a new uptrend is under way. |
Alan Northam lives in the Dallas, Texas area and as an electronic engineer gave him an analytical mind from which he has developed a thorough knowledge of stock market technical analysis. His abilities to analyze the future direction of the stock market has allowed him to successfully trade of his own portfolio over the last 30 years. Mr. Northam is now retired and trading the stock market full time. You can reach him at inquiry@tradersclassroom.com or by visiting his website at http://www.tradersclassroom.com. You can also follow him on Twitter @TradersClassrm.
| Garland, Tx | |
| Website: | www.tradersclassroom.com |
| E-mail address: | inquiry@tradersclassroom.com |
Click here for more information about our publications!
Comments
Date: 01/19/10Rank: 5Comment:
Date: 01/20/10Rank: 5Comment:

|

Request Information From Our Sponsors
- StockCharts.com, Inc.
- Candle Patterns
- Candlestick Charting Explained
- Intermarket Technical Analysis
- John Murphy on Chart Analysis
- John Murphy's Chart Pattern Recognition
- John Murphy's Market Message
- MurphyExplainsMarketAnalysis-Intermarket Analysis
- MurphyExplainsMarketAnalysis-Visual Analysis
- StockCharts.com
- Technical Analysis of the Financial Markets
- The Visual Investor
- VectorVest, Inc.
- Executive Premier Workshop
- One-Day Options Course
- OptionsPro
- Retirement Income Workshop
- Sure-Fire Trading Systems (VectorVest, Inc.)
- Trading as a Business Workshop
- VectorVest 7 EOD
- VectorVest 7 RealTime/IntraDay
- VectorVest AutoTester
- VectorVest Educational Services
- VectorVest OnLine
- VectorVest Options Analyzer
- VectorVest ProGraphics v6.0
- VectorVest ProTrader 7
- VectorVest RealTime Derby Tool
- VectorVest Simulator
- VectorVest Variator
- VectorVest Watchdog
