HOT TOPICS LIST
- MACD
- Fibonacci
- RSI
- Gann
- ADXR
- Stochastics
- Volume
- Triangles
- Futures
- Cycles
- Volatility
- ZIGZAG
- MESA
- Retracement
- Aroon
INDICATORS LIST
LIST OF TOPICS
PRINT THIS ARTICLE
by David Penn
Like a number of agricultural commodities, pork bellies are rallying from lows not seen since the beginning of the year.
Position: N/A
David Penn
Technical Writer for Technical Analysis of STOCKS & COMMODITIES magazine, Working-Money.com, and Traders.com Advantage.
PRINT THIS ARTICLE
FLAGS AND PENNANTS
Pork Bellies' Flag
11/26/01 09:35:12 AMby David Penn
Like a number of agricultural commodities, pork bellies are rallying from lows not seen since the beginning of the year.
Position: N/A
| Whether or not you've been paying much attention to the deflation thesis that's been gaining ground in mainstream economic news, there's been no argument that commodity prices have taken a beating in the past year. The CRB index peaked at the beginning of 2001--after rallying 21% from a bottom in 1999--and has been declining ever since. Presently, however, strength in agricultural commodities--cocoa, for example, as well as coffee--among other areas has encouraged some suspicion that commodities as a group may be bottoming. The enduring, post-September 11th rally in stocks also has many thinking that an economic recovery--and with it higher commodities prices--may be in the works. |
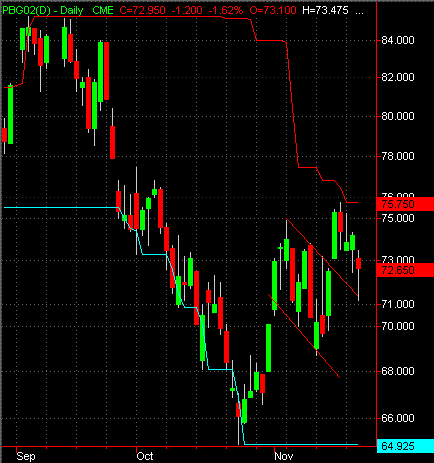
| Pork bellies, while not as "stricken" as some other livestock commodities (the anthrax scares in October allegedly hurt cattle prices to the benefit of hogs), has been in a downtrend since reaching a contract high of 85.24 in September. After falling 23% over the following two months, pork bellies (as measured by the February contract) rallied sharply to an intraday high of 74.9 before slipping back into a consolidation between 73 and 69. |

|
| Midway through this rally, a flag formation suggests more rally to come. |
| Graphic provided by: TradeStation. |
| |
| Fortunately for pork belly bulls, the consolidation--occurring in November--has all the earmarks of a bull flag formation, which tends to anticipate a continuation of the prevailing trend. Flag formations are not uncommon consolidation patterns in trends and, usually lasting a few days to a few weeks at most, provide a countertrend for accumulation or distribution. In the case of an uptrend--and one that is still relatively early (again, looking at the February pork belly trend since late October)--flags are often accumulation areas for savvy traders, who are confident about buying into the temporary weakness in the trend, while less sure hands take profits from the early leg of the up move. |
| There has already been a breakout and pullback in this flag, making the next few trading days very significant ones. The initial breakout failed as it encountered resistance near the 30-day high (shown by the 30-day price channel lines), as well as the resistance created by the gap down in late September as February bellies broke down. Nevertheless the most recent trading in February bellies has resulted in prices that are still above the topmost line in the flag formation (save for the worst of the intraday selling on the most recent day shown), which suggests that some support might be found along this line. |
| Should February bellies resume their breakout, prices could reach the 79 area. This is deduced from the flag formation's unique measuring rule, which calls for the difference between the start of the trend and the beginning of the formation itself to be added to the breakout point. Such a rule takes the beginning of the trend at 65 and the start of the formation at 71, with the breakout point at approximately 73. |
Technical Writer for Technical Analysis of STOCKS & COMMODITIES magazine, Working-Money.com, and Traders.com Advantage.
| Title: | Technical Writer |
| Company: | Technical Analysis, Inc. |
| Address: | 4757 California Avenue SW |
| Seattle, WA 98116 | |
| Phone # for sales: | 206 938 0570 |
| Fax: | 206 938 1307 |
| Website: | www.Traders.com |
| E-mail address: | DPenn@traders.com |
Traders' Resource Links | |
| Charting the Stock Market: The Wyckoff Method -- Books | |
| Working-Money.com -- Online Trading Services | |
| Traders.com Advantage -- Online Trading Services | |
| Technical Analysis of Stocks & Commodities -- Publications and Newsletters | |
| Working Money, at Working-Money.com -- Publications and Newsletters | |
| Traders.com Advantage -- Publications and Newsletters | |
| Professional Traders Starter Kit -- Software | |
Click here for more information about our publications!
PRINT THIS ARTICLE

Request Information From Our Sponsors
- StockCharts.com, Inc.
- Candle Patterns
- Candlestick Charting Explained
- Intermarket Technical Analysis
- John Murphy on Chart Analysis
- John Murphy's Chart Pattern Recognition
- John Murphy's Market Message
- MurphyExplainsMarketAnalysis-Intermarket Analysis
- MurphyExplainsMarketAnalysis-Visual Analysis
- StockCharts.com
- Technical Analysis of the Financial Markets
- The Visual Investor
- VectorVest, Inc.
- Executive Premier Workshop
- One-Day Options Course
- OptionsPro
- Retirement Income Workshop
- Sure-Fire Trading Systems (VectorVest, Inc.)
- Trading as a Business Workshop
- VectorVest 7 EOD
- VectorVest 7 RealTime/IntraDay
- VectorVest AutoTester
- VectorVest Educational Services
- VectorVest OnLine
- VectorVest Options Analyzer
- VectorVest ProGraphics v6.0
- VectorVest ProTrader 7
- VectorVest RealTime Derby Tool
- VectorVest Simulator
- VectorVest Variator
- VectorVest Watchdog
