HOT TOPICS LIST
- MACD
- Fibonacci
- RSI
- Gann
- ADXR
- Stochastics
- Volume
- Triangles
- Futures
- Cycles
- Volatility
- ZIGZAG
- MESA
- Retracement
- Aroon
INDICATORS LIST
LIST OF TOPICS
PRINT THIS ARTICLE
by Koos van der Merwe
The price of the online marketplace has finally recovered from the meltdown of the markets. Now, how high can it go?
Position: Buy
Koos van der Merwe
Has been a technical analyst since 1969, and has worked as a futures and options trader with First Financial Futures in Johannesburg, South Africa.
PRINT THIS ARTICLE
ELLIOTT WAVE
Will You Find It In eBay Stock?
01/15/10 08:57:49 AMby Koos van der Merwe
The price of the online marketplace has finally recovered from the meltdown of the markets. Now, how high can it go?
Position: Buy
| With more than 88 million active users globally, eBay (EBAY) is the world's largest online marketplace, where practically anyone can buy and sell practically anything. Founded in 1995, eBay connects a diverse and passionate community of individual buyers and sellers, as well as small businesses. Their collective impact on e-commerce is staggering: In 2008, the total worth of goods sold on eBay was $60 billion — something like $2,000 every second. It is therefore understandable that in a weakening economy, when sales decline, sales via eBay must decline, and so it did. The company also made some purchases of other companies like Skype, which did not endear it to shareholders who believed that they overpaid. Whatever the reason, we should not ask why the EBAY chart has given a buy signal; we should simply accept that it has. The whys come later. Before anything else, however, let us look at a chart. |

|
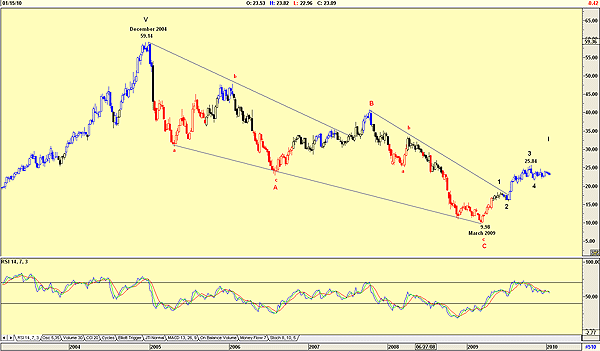
| FIGURE 1: EBAY, WEEKLY |
| Graphic provided by: AdvancedGET. |
| |
| Figure 1 is a weekly chart and shows how EBAY has fallen from a high of $59.14 in December 2004 to a low of $9.98 by March 2009. An Elliott wave count taking the high of $59.14 as the wave V top suggests that the share price is in a wave 5 of a wave I in a new bull market. To get a more accurate count, I now look at my daily chart, seen in Figure 2. |

|
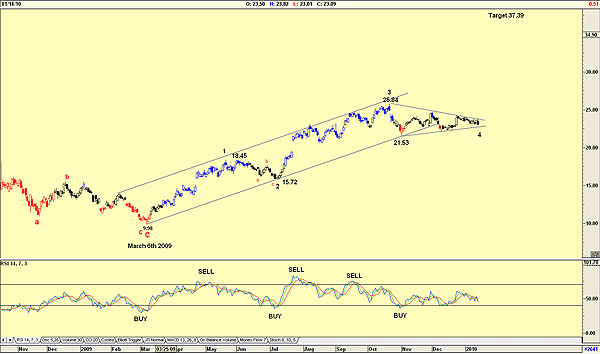
| FIGURE 2: EBAY, DAILY |
| Graphic provided by: AdvancedGET. |
| |
| Figure 2 shows the following: -The length of wave 1 is 8.47. -The length of wave 3 is 10.12. Wave 3 is therefore larger than wave 1, which means that wave 5 should be equal to or greater than wave 1. -The wave 2 correction was a simple abc correction, which means that wave 4 should be a complicated correction, and looking at the chart, we can see that it is. -Wave 4 appears to be tracing a triangle formation, which allows us to calculate a target. The target is calculated as follows: 25.84 - 9.98 = 15.86 + 21.53 = 37.39 -Finally, do note how accurate the relative strength index (RSI) has been in calling buys and sells. At present, the indicator is in buy mode but moving sideways. To conclude, I would be a buyer of EBAY at current levels with a target price of $37.39. |
Has been a technical analyst since 1969, and has worked as a futures and options trader with First Financial Futures in Johannesburg, South Africa.
| Address: | 3256 West 24th Ave |
| Vancouver, BC | |
| Phone # for sales: | 6042634214 |
| E-mail address: | petroosp@gmail.com |
Click here for more information about our publications!
Comments
Date: 01/19/10Rank: 3Comment:

Request Information From Our Sponsors
- StockCharts.com, Inc.
- Candle Patterns
- Candlestick Charting Explained
- Intermarket Technical Analysis
- John Murphy on Chart Analysis
- John Murphy's Chart Pattern Recognition
- John Murphy's Market Message
- MurphyExplainsMarketAnalysis-Intermarket Analysis
- MurphyExplainsMarketAnalysis-Visual Analysis
- StockCharts.com
- Technical Analysis of the Financial Markets
- The Visual Investor
- VectorVest, Inc.
- Executive Premier Workshop
- One-Day Options Course
- OptionsPro
- Retirement Income Workshop
- Sure-Fire Trading Systems (VectorVest, Inc.)
- Trading as a Business Workshop
- VectorVest 7 EOD
- VectorVest 7 RealTime/IntraDay
- VectorVest AutoTester
- VectorVest Educational Services
- VectorVest OnLine
- VectorVest Options Analyzer
- VectorVest ProGraphics v6.0
- VectorVest ProTrader 7
- VectorVest RealTime Derby Tool
- VectorVest Simulator
- VectorVest Variator
- VectorVest Watchdog
