

HOT TOPICS LIST
- MACD
- Fibonacci
- RSI
- Gann
- ADXR
- Stochastics
- Volume
- Triangles
- Futures
- Cycles
- Volatility
- ZIGZAG
- MESA
- Retracement
- Aroon
INDICATORS LIST
LIST OF TOPICS
PRINT THIS ARTICLE
by Ron Walker
Correlating signals in multiple time frames increases the odds of a successful trade. Selecting a quality setup, like a reversal chart pattern in a micro time frame along with it, offers a trader endless opportunities to create wealth and protect capital.
Position: N/A
Ron Walker
Ron Walker is an active trader and technical analyst. He operates an educational website dedicated to the study of Technical Analysis. The website offers free market analysis with daily video presentations and written commentaries. Ron is a video pioneer, being one of the first to utilize the internet producing Technical Analysis videos. His website is thechartpatterntrader.com
PRINT THIS ARTICLE
REVERSAL
Three Signals Are Better Than One
01/14/10 10:07:17 AMby Ron Walker
Correlating signals in multiple time frames increases the odds of a successful trade. Selecting a quality setup, like a reversal chart pattern in a micro time frame along with it, offers a trader endless opportunities to create wealth and protect capital.
Position: N/A
| After a robust recovery in 2009, the Russell 2000 iShares (IWM) looks to be overheating. Unfortunately, IWM is up against heavy resistance in the weekly time frame, where a long-term downward trendline is sloping, which increases the odds of stalling the advance (Figure 1). The problem is that prices have risen right into resistance and have hesitated as several bearish divergences have emerged on the scene of the weekly chart. The relative strength index (RSI) (14), the moving average convergence/divergence histogram (MACDH) (12, 26, 9), and the MACD (12, 26, 9) are each chiseling out lower peaks. Once the MACD histogram is finished etching out a lower tower, it could complete the bearish divergence by turning lower and changing the slope. Once it moves below the zero line, the MACD will get a bearish cross, completing its bearish divergence. |
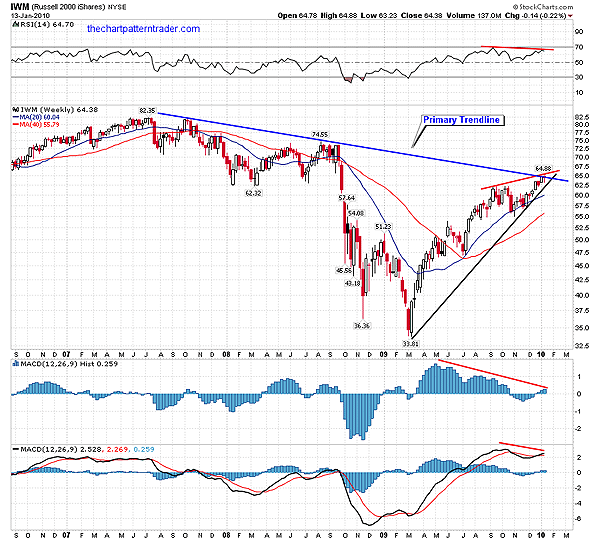
|
| FIGURE 1: IWM, WEEKLY. Several bearish divergences are forming at the primary trendline. A lower peak on the histogram turned the MACD down. |
| Graphic provided by: StockCharts.com. |
| |
| Conditions on the daily chart are starting to show some signs that prices are beginning to weaken, which may spill over into the weekly time frame completing the bearish divergence. Figure 2 exhibits that IWM had made several erratic price moves centered around the 20-day MA from September to November, followed by a Santa Claus rally that got under way after prices slipped back below the 20-day moving average (MA) for a quick dip in late November. In early December, IWM managed to leap back up above the 20-day MA. This produced a higher low on the daily chart in the mid-$56 area. IWM then went on to catapult above the 50-day and to tackle some resistance just above $60. After hopping over that hurdle, prices went ballistic and rocketed higher, furthering the price acceleration as prices evolved into a rising wedge pattern. This accelerated trendline is an important trendline because it touches at four points. So when it was violated on January 12, it was a significant event. The bears managed to pound prices lower, causing IWM to skid below the trendline. After penetration of the accelerated trendline, prices revived and began traveling upward, approaching the previous high. A successful backtest of the trendline would make way for a lower high to be established because the accelerated trendline already broke down, thereby eroding rising support. Thus, the trendline can now reverse roles by becoming resistance on the subsequent rally attempt. Immediately after the prices pierced through the trendline, in the next session, a half-hearted rally with mediocre volume drove prices back up to test the trendline (Figure 2). So far, the bulls have been unsuccessful in pushing prices back above the broken trendline. This tells us that IWM might be exhausted, for now, anyway. |
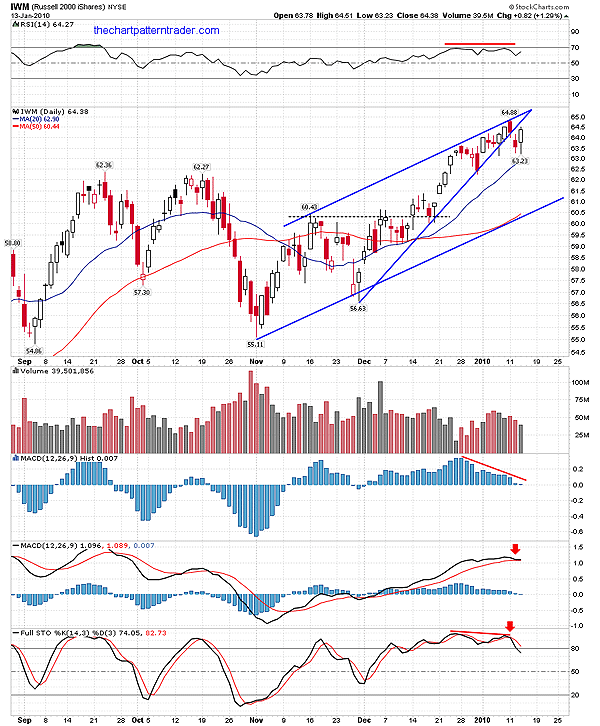
|
| FIGURE 2: IWM, DAILY. The bearish divergences the RSI, histogram, and stochastic may result in the MACD finally tipping over below its signal line. |
| Graphic provided by: StockCharts.com. |
| |
| Figure 2 also shows that momentum has shifted to the downside on IWM's daily chart, which may allow the bears to inflict technical mayhem into the situation. The MACD histogram is now sloping down, forming a bearish divergence. Even though during the throwback rally, the slope on the histogram did not change. Again, if the histogram bars move below the zero line, it will result in a bearish MACD crossover on the daily chart. The stochastic is in agreement with the histogram, rolling over after completing a bearish divergence, followed by %K, flying sharply away from %D. The widening spread suggests further price chaos. So momentum is down on the daily chart and may allow the weekly chart to peak at its primary trendline in order to complete its divergences. Momentum indicators are a derivative of price. So when momentum shifts, it gives a sneak preview of what is likely coming down the pike. But volume is independent from price and needs to confirm any price movement. That means if a reversal is under construction it needs to be backed up by an increase in volume as prices move lower, a sign that distribution is taking place. |
|
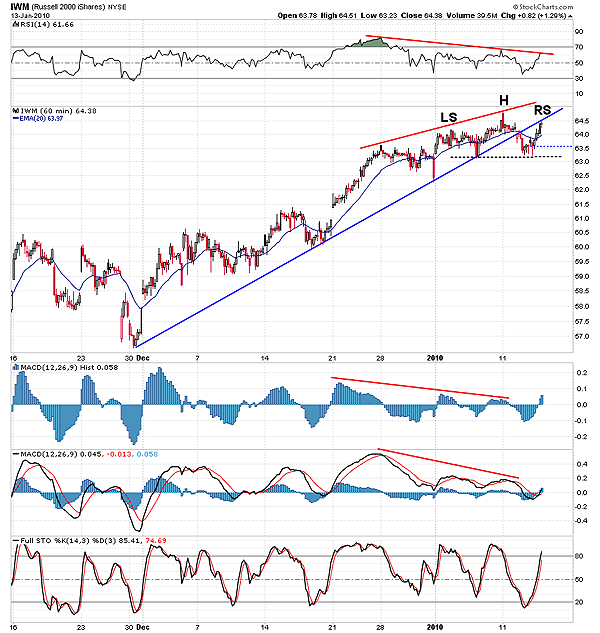
| FIGURE 3: IWM, 60-MINUTE. After penetration of the trendline, it reversed roles, and what was once support now becomes resistance. It was negative divergence that broke the trend, but a head & shoulders may produce a full-fledged reversal. |
| Graphic provided by: StockCharts.com. |
| |
| The hourly chart also reflects a bearish tone (Figure 3). Looking through the microscope on the 60-minute chart, we can see that the breakdown of the trendline was the result of bearish divergences that set up the RSI (14), MACDH (12, 26, 9), and the MACD (12, 26, 9). The trendline is acting as potent resistance to the rally in play. The hourly chart could be grinding through a head & shoulders topping pattern, with a neckline of support slightly above $63. The backtest to the trendline could create a right shoulder, completing the pattern. But prices must establish a lower high and then move beyond the low that was made after the trendline broke. That would produce a miniature 1-2-3 trend reversal on the hourly chart. Keep in mind that this entire move is likely only a larger part of a 1-2-3 trend reversal on the daily chart. This miniature 1-2-3 reversal would set up the "1" on the daily chart. (I explained the 1-2-3 trend reversal in an article I wrote for Traders.com Advantage titled "Starbucks Undergoes A Test," on January 11, 2010). |
| Since prices rose at such a steep angle over the last several weeks, they became extended and overbought as IWM slammed into resistance on the weekly chart. Common sense indicates to exit a long position and/or try to find a new short entry. Here are two possible entry points to play the short side, should a lower high develop. As prices rally back to test the broken trendline, watch for a pivot reversal to occur that would be evident by some type of a reversal candle pattern setup. If a pivot reversal doesn't manifest itself, the head & shoulders chart pattern will fail. Just like the dark cloud cover candle pattern that formed on the head on the hourly chart. Two low-risk trades can be taken here. A trader can choose to sell short at the pivot reversal as a lower high is being established or wait until IWM falls down and collapses through the neckline of support. A protective stop (around $0.25) can be placed above the last minor high at $64.88. If the chart pattern fails, you will be stopped out of the trade. Keep in mind that every signal doesn't always pan out in technical analysis, but having three sell signals in three different time frames heightens the odds of a successful trade. |
Ron Walker is an active trader and technical analyst. He operates an educational website dedicated to the study of Technical Analysis. The website offers free market analysis with daily video presentations and written commentaries. Ron is a video pioneer, being one of the first to utilize the internet producing Technical Analysis videos. His website is thechartpatterntrader.com
| Website: | thechartpatterntrader.com |
| E-mail address: | thechartpatterntrader@gmail.com |
Click here for more information about our publications!
Comments
Date:�01/14/10Rank:�4Comment:�
Date:�01/14/10Rank:�5Comment:�
Date:�01/21/10Rank:�5Comment:�

Request Information From Our Sponsors
- StockCharts.com, Inc.
- Candle Patterns
- Candlestick Charting Explained
- Intermarket Technical Analysis
- John Murphy on Chart Analysis
- John Murphy's Chart Pattern Recognition
- John Murphy's Market Message
- MurphyExplainsMarketAnalysis-Intermarket Analysis
- MurphyExplainsMarketAnalysis-Visual Analysis
- StockCharts.com
- Technical Analysis of the Financial Markets
- The Visual Investor
- VectorVest, Inc.
- Executive Premier Workshop
- One-Day Options Course
- OptionsPro
- Retirement Income Workshop
- Sure-Fire Trading Systems (VectorVest, Inc.)
- Trading as a Business Workshop
- VectorVest 7 EOD
- VectorVest 7 RealTime/IntraDay
- VectorVest AutoTester
- VectorVest Educational Services
- VectorVest OnLine
- VectorVest Options Analyzer
- VectorVest ProGraphics v6.0
- VectorVest ProTrader 7
- VectorVest RealTime Derby Tool
- VectorVest Simulator
- VectorVest Variator
- VectorVest Watchdog