HOT TOPICS LIST
- MACD
- Fibonacci
- RSI
- Gann
- ADXR
- Stochastics
- Volume
- Triangles
- Futures
- Cycles
- Volatility
- ZIGZAG
- MESA
- Retracement
- Aroon
INDICATORS LIST
LIST OF TOPICS
PRINT THIS ARTICLE
by Alan R. Northam
One of the useful aspects of the Andrews pitchfork is that it can be drawn from any series of three alternating high and low pivot points. With each pitchfork drawn, a story about the trend is told. With each of the pitchforks drawn as seen here, the story of the Gold Miners ETF is unraveled.
Position: N/A
Alan R. Northam
Alan Northam lives in the Dallas, Texas area and as an electronic engineer gave him an analytical mind from which he has developed a thorough knowledge of stock market technical analysis. His abilities to analyze the future direction of the stock market has allowed him to successfully trade of his own portfolio over the last 30 years. Mr. Northam is now retired and trading the stock market full time. You can reach him at inquiry@tradersclassroom.com or by visiting his website at http://www.tradersclassroom.com. You can also follow him on Twitter @TradersClassrm.
PRINT THIS ARTICLE
ANDREWS PITCH-FORK
The Gold Miner And The Pitchfork
01/13/10 10:20:31 AMby Alan R. Northam
One of the useful aspects of the Andrews pitchfork is that it can be drawn from any series of three alternating high and low pivot points. With each pitchfork drawn, a story about the trend is told. With each of the pitchforks drawn as seen here, the story of the Gold Miners ETF is unraveled.
Position: N/A
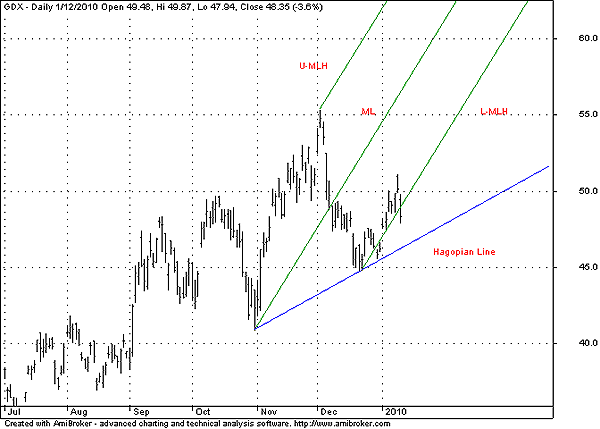
| One of the beautiful aspects of the Andrews pitchfork is that you can draw it from any three pivot points and it will tell a story about the trend under way. In Figure 1, I have drawn the Andrews pitchfork off the last three pivots of the current trend of the Gold Miners exchange traded fund (ETF)(GDX). Note that from late December 2009, GDX has been trading along the lower horizontal line of the pitchfork. Alan Hall Andrews called this lower pitchfork line the "lower median line horizontal" or "L_MLH" because it is drawn below the median line (ML) and horizontal to it (Andrews used the term "horizontal" instead of "parallel"). Andrews noted that 80% of the time, price would rally up to the median line of the pitchfork and then reverse down. When the price failed to move up to the median line before reversing trend, Andrews noted that the price reversal would most likely go further than it did on its approach to the median line. |

|
| FIGURE 1: GDX, DAILY. Here are the pitchfork and the Hagopian line. |
| Graphic provided by: AmiBroker.com. |
| |
| The story that the pitchfork is telling is that the Gold Miners ETF is not moving up to the median line of the pitchfork as should be expected. This tells us that if price reverses trend before reaching the median line the price reversal will go further in the direction of the reversal than it would if price first reached the median line. |
| In addition, the story that the pitchfork is telling warrants the drawing of the Hagopian line (see my January 12, 2010, Traders.com article). Whenever price continues to follow the lower horizontal line of the pitchfork, the drawing of a Hagopian line is warranted. The reason for this is because any market correction to the upward rally could more easily break below the Hagopian line, signaling a trend reversal than it would if price had moved closer to the median line. If price were to move upward at a steeper rate and toward the median line, any market correction most likely would not be severe enough to move below the path of the Hagopian line. Under those conditions, it would not be necessary to draw the Hagopian line. |
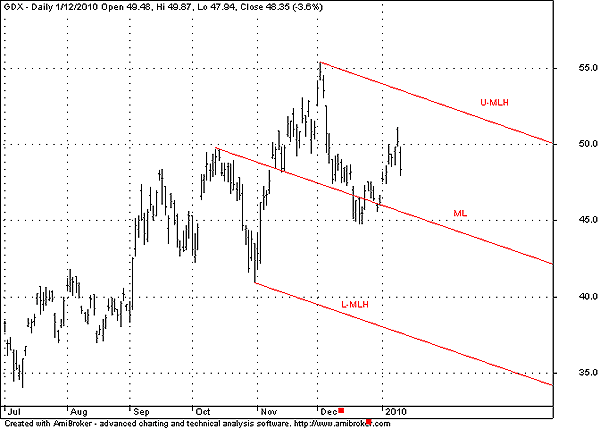
| Since Andrews pitchforks can be drawn off three pivots, I have drawn another pitchfork in Figure 2. The pitchfork tells us more about the story of the gold miners and the pitchfork. Note in Figure 2 price did manage to move down to the median line of the pitchfork and reverse directions. This indicates that price is now in an upward trend and headed for the upper horizontal line of the pitchfork, which acts as resistance. Therefore, for the uptrend in the GDX to continue, price must break out above this line of resistance. If price does not break out above the upper horizontal line of the pitchfork but instead reverses back down, it will indicate that GDX has reversed trends from up to down as signified by the down slope of the median line. |

|
| FIGURE 2: GDX, DAILY. Here's the pitchfork. |
| Graphic provided by: AmiBroker.com. |
| |
| In conclusion, GDX is still in an upward trend, but failure of price to break out above the upper horizontal line of the pitchfork in Figure 2 will constitute a reversal in trend from up to down. |
Alan Northam lives in the Dallas, Texas area and as an electronic engineer gave him an analytical mind from which he has developed a thorough knowledge of stock market technical analysis. His abilities to analyze the future direction of the stock market has allowed him to successfully trade of his own portfolio over the last 30 years. Mr. Northam is now retired and trading the stock market full time. You can reach him at inquiry@tradersclassroom.com or by visiting his website at http://www.tradersclassroom.com. You can also follow him on Twitter @TradersClassrm.
| Garland, Tx | |
| Website: | www.tradersclassroom.com |
| E-mail address: | inquiry@tradersclassroom.com |
Click here for more information about our publications!
Comments
Date: 01/13/10Rank: 2Comment:

Request Information From Our Sponsors
- StockCharts.com, Inc.
- Candle Patterns
- Candlestick Charting Explained
- Intermarket Technical Analysis
- John Murphy on Chart Analysis
- John Murphy's Chart Pattern Recognition
- John Murphy's Market Message
- MurphyExplainsMarketAnalysis-Intermarket Analysis
- MurphyExplainsMarketAnalysis-Visual Analysis
- StockCharts.com
- Technical Analysis of the Financial Markets
- The Visual Investor
- VectorVest, Inc.
- Executive Premier Workshop
- One-Day Options Course
- OptionsPro
- Retirement Income Workshop
- Sure-Fire Trading Systems (VectorVest, Inc.)
- Trading as a Business Workshop
- VectorVest 7 EOD
- VectorVest 7 RealTime/IntraDay
- VectorVest AutoTester
- VectorVest Educational Services
- VectorVest OnLine
- VectorVest Options Analyzer
- VectorVest ProGraphics v6.0
- VectorVest ProTrader 7
- VectorVest RealTime Derby Tool
- VectorVest Simulator
- VectorVest Variator
- VectorVest Watchdog
