HOT TOPICS LIST
- MACD
- Fibonacci
- RSI
- Gann
- ADXR
- Stochastics
- Volume
- Triangles
- Futures
- Cycles
- Volatility
- ZIGZAG
- MESA
- Retracement
- Aroon
INDICATORS LIST
LIST OF TOPICS
PRINT THIS ARTICLE
by Koos van der Merwe
Fossil offers fashion accessories all over the world, but how's the stock look?
Position: Sell
Koos van der Merwe
Has been a technical analyst since 1969, and has worked as a futures and options trader with First Financial Futures in Johannesburg, South Africa.
PRINT THIS ARTICLE
GANN
Is The Time Right For Fossil?
01/13/10 08:43:09 AMby Koos van der Merwe
Fossil offers fashion accessories all over the world, but how's the stock look?
Position: Sell
| Fossil sells fashion accessories all over the world in numerous variations, but what does the share price look like, and is the stock a buy at the moment? |

|
| FIGURE 1: FOSL, WEEKLY |
| Graphic provided by: AdvancedGET. |
| |
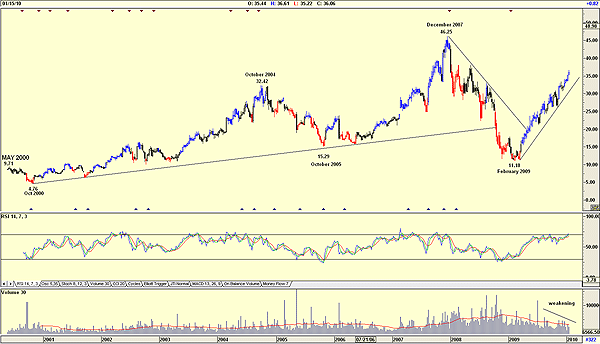
| Figure 1 suggests that the company came to the market in May 2000, which is unusual, because that was the start of the bear market. After dropping to a low of $4.76 from a high of $9.71 the share price started rising reaching a high in October 2004 of $32.42. After falling to a low of $15.29 by October 2005, the share price started rising strongly to reach a high of $46.25 by December 2007. From that date, along with the C-wave in the Dow Jones Industrial Average (DJIA) and the Standard & Poor's 500, the share price dropped to a low of $11.18 by February 2009. From then, along with the recovery in the economy, the share price has risen to its present price of $36.06. Volatile, yes, but the movement of the share price can be regarded as a good indicator of consumer sentiment and buying habits especially because the company derives its profits from local as well as international markets. Figure 1 is suggesting weakness ahead, because the relative strength index (RSI) has approached overbought levels, and the volume has been falling as the share price rose, a sign of weakness. This is disturbing because it is confirming that a correction in the market is now due. What does our daily chart tell us? |

|
| FIGURE 2: FOSL, DAILY |
| Graphic provided by: Omnitrader Professional.. |
| |
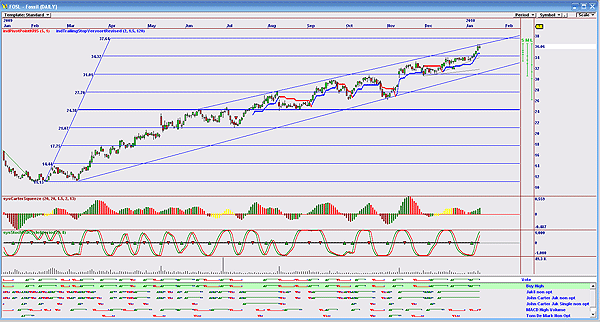
| Figure 2 shows how the share price has risen strongly from February 2009 after forming a double bottom from $11.13 to its present price of $36.06. The chart shows the following: a. I have divided the difference between the high and low into Gann eights using the horizontals to highlight major resistance and support levels. This technique does suggest that the price could rise to $37.64. b. A parallel trendline is suggesting a top at present levels. c. The Carter squeeze indicator is still rising. d. The stochastic RSI cycle indicator is still rising. e. The vote line, made up of a number of strategies, has stopped out, suggesting weakness ahead. f. The share price on the chart is still above its rising stop. This is a share I would not buy at present levels. With the volatility previously noted, I would start considering a buy when the price drops to the $24.38 level, which is a 50% retracement, or any other support level as suggested by the horizontal lines of the eights indicator as shown on the chart, as long as both indicators and the vote line suggest a buy. |
Has been a technical analyst since 1969, and has worked as a futures and options trader with First Financial Futures in Johannesburg, South Africa.
| Address: | 3256 West 24th Ave |
| Vancouver, BC | |
| Phone # for sales: | 6042634214 |
| E-mail address: | petroosp@gmail.com |
Click here for more information about our publications!
PRINT THIS ARTICLE

Request Information From Our Sponsors
- StockCharts.com, Inc.
- Candle Patterns
- Candlestick Charting Explained
- Intermarket Technical Analysis
- John Murphy on Chart Analysis
- John Murphy's Chart Pattern Recognition
- John Murphy's Market Message
- MurphyExplainsMarketAnalysis-Intermarket Analysis
- MurphyExplainsMarketAnalysis-Visual Analysis
- StockCharts.com
- Technical Analysis of the Financial Markets
- The Visual Investor
- VectorVest, Inc.
- Executive Premier Workshop
- One-Day Options Course
- OptionsPro
- Retirement Income Workshop
- Sure-Fire Trading Systems (VectorVest, Inc.)
- Trading as a Business Workshop
- VectorVest 7 EOD
- VectorVest 7 RealTime/IntraDay
- VectorVest AutoTester
- VectorVest Educational Services
- VectorVest OnLine
- VectorVest Options Analyzer
- VectorVest ProGraphics v6.0
- VectorVest ProTrader 7
- VectorVest RealTime Derby Tool
- VectorVest Simulator
- VectorVest Variator
- VectorVest Watchdog
