HOT TOPICS LIST
- MACD
- Fibonacci
- RSI
- Gann
- ADXR
- Stochastics
- Volume
- Triangles
- Futures
- Cycles
- Volatility
- ZIGZAG
- MESA
- Retracement
- Aroon
INDICATORS LIST
LIST OF TOPICS
PRINT THIS ARTICLE
by Donald W. Pendergast, Jr.
Take an intraday trip through the gold futures market, using the three- and fifteen-minute charts as a road map.
Position: N/A
Donald W. Pendergast, Jr.
Donald W. Pendergast is a financial markets consultant who offers specialized services to stock brokers and high net worth individuals who seek a better bottom line for their portfolios.
PRINT THIS ARTICLE
CHART ANALYSIS
Gold Pennants, Breakdowns, Washouts, Reversals
01/12/10 09:16:49 AMby Donald W. Pendergast, Jr.
Take an intraday trip through the gold futures market, using the three- and fifteen-minute charts as a road map.
Position: N/A
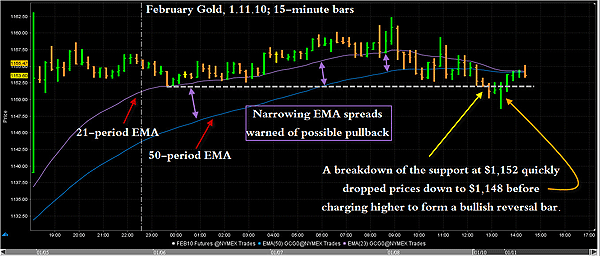
| During the overnight session, COMEX February 2010 gold experienced a major rally, rising by more than $20 from Friday's closing price; at one point gold made it past $1,163 before settling down during Monday, January 11's regular daily session. On a daily basis, the pattern may be some sort of an exhaustion gap into major overhead resistance — remember, February gold was at $1,226 in early December and then tumbled to $1,075 in less than three weeks. The area between $1,142 and $1,169 is rife with a variety of potential Fibonacci retracement and extension levels, so traders considering going long here might want to do so only on an intraday basis until February gold can make a convincing daily close above $1,169. Let's face it, gold is going to do whatever it wants to do, just like any other commodity, and the best we can do is to try to determine the lowest risk entry and exit points. The ultimate path of gold aside, however, today's intraday action in the gold market was full of chart patterns and/or dynamics, three of which we'll cover in this article. For starters, we'll look at the 15-minute chart of the February COMEX gold contract (Figure 1). |

|
| FIGURE 1: GOLD, 15-MINUTE. Narrowing EMA spreads and a strong intraday support level are some of the guideposts available to intraday gold futures traders. |
| Graphic provided by: Interactive Brokers TWS 15-minute chart. |
| |
| At the extreme left side of the chart you can see the massive 15-minute bar that brought gold up to the $1,163 area at about 7:00 pm ET on Sunday night; in the aftermath of that move, however, price simply meandered back and forth in a narrow range for the next 12 hours or so, failing to provide any real clues as to the next trend thrust. Wise technicians would also have been keeping an eye on the support level at $1,152 (dashed gray line), as a solid break below it might have initiated a substantial corrective move lower. Savvy chartists would also have noted that the spread between the 21- and 50-period exponential moving averages (EMAs)had narrowed significantly by the time of the morning session's open at 0930 ET; it was an early warning of a possible trend reversal and/or corrective move. So, with the big picture in view, we'll take a look now at what went down on the three-minute gold chart. |

|
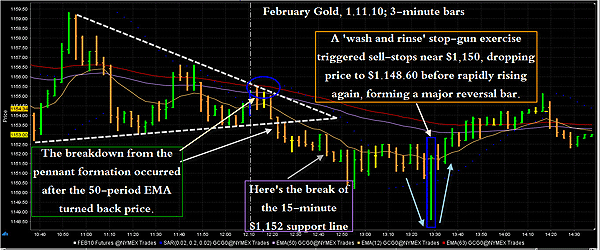
| FIGURE 2: GOLD, THREE-MINUTE. While the price action coming out of the pennant breakdown was widely anticipated, the wild wash & rinse reversal action at 1327–1330 was not. |
| Graphic provided by: Interactive Brokers TWS 3-minute chart. |
| |
| Since we already know that the spread between the 21- and 50-period EMAs on the 15-minute chart were contracting by the time the morning session commenced, the completion of a near-perfect pennant formation at 12:15 pm was also of great interest to those interested in a possible short setup. Aggressive traders were able to jump in on a break (at 12:22 pm) below the lower pennant boundary and were able to pick up a couple of handles by the time 1:00 pm rolled around. The trade went short at $1,153.25 and then proceeded to take out that critical intraday support level of $1,152, too. So far so, good — a winning chart pattern trade that was in line with the higher time frame trend dynamics. The big question was, of course, this: Was this the first warning of a major trend reversal or just a minor pullback in a major bull rally in gold? |
| The sharp downthrust that commenced at about 1:28 pm was destined to answer that particular question, but only after it had faked out plenty of short-sellers who had already positioned themselves to pull the trigger at the $1.150 area. The downthrust triggered a wave of short sales that quickly dropped gold down to $1,148.60, but it only remained there for a few moments before it suddenly started to rocket back up to the $1,151 area, again triggering a fresh wave of buy-stop orders (to cover the short sales instituted near $1,150) that provided even more fuel to push the market higher. This amazing market reversal finally petered out near $1,155 at 2:16 pm. If nothing else, trading events like this should help remind us that at times the market will respond in a way that we generally anticipate, the lovely three-minute pennant/15-minute support breakdown move being a prime example. At the same time, the unexpected and violent "wash & rinse" reversal bar (Figure 2) should also serve to warn us that the market can and will react in ways not normally able to be detected and/or anticipated by normal technical trading tools. If you were the unfortunate trader who shorted gold at $1,150 today, hopefully you had placed a buy-stop order to take you out of the trade with minimal losses. If you didn't, well, then you might have had to take a much larger loss. In futures trading, your best offense is a good defense — always use stops and modest position sizing. |
Donald W. Pendergast is a financial markets consultant who offers specialized services to stock brokers and high net worth individuals who seek a better bottom line for their portfolios.
| Title: | Writer, market consultant |
| Company: | Linear Trading Systems LLC |
| Jacksonville, FL 32217 | |
| Phone # for sales: | 904-239-9564 |
| E-mail address: | lineartradingsys@gmail.com |
Traders' Resource Links | |
| Linear Trading Systems LLC has not added any product or service information to TRADERS' RESOURCE. | |
Click here for more information about our publications!
Comments
Date: 01/13/10Rank: 3Comment:

Request Information From Our Sponsors
- StockCharts.com, Inc.
- Candle Patterns
- Candlestick Charting Explained
- Intermarket Technical Analysis
- John Murphy on Chart Analysis
- John Murphy's Chart Pattern Recognition
- John Murphy's Market Message
- MurphyExplainsMarketAnalysis-Intermarket Analysis
- MurphyExplainsMarketAnalysis-Visual Analysis
- StockCharts.com
- Technical Analysis of the Financial Markets
- The Visual Investor
- VectorVest, Inc.
- Executive Premier Workshop
- One-Day Options Course
- OptionsPro
- Retirement Income Workshop
- Sure-Fire Trading Systems (VectorVest, Inc.)
- Trading as a Business Workshop
- VectorVest 7 EOD
- VectorVest 7 RealTime/IntraDay
- VectorVest AutoTester
- VectorVest Educational Services
- VectorVest OnLine
- VectorVest Options Analyzer
- VectorVest ProGraphics v6.0
- VectorVest ProTrader 7
- VectorVest RealTime Derby Tool
- VectorVest Simulator
- VectorVest Variator
- VectorVest Watchdog
