HOT TOPICS LIST
- MACD
- Fibonacci
- RSI
- Gann
- ADXR
- Stochastics
- Volume
- Triangles
- Futures
- Cycles
- Volatility
- ZIGZAG
- MESA
- Retracement
- Aroon
INDICATORS LIST
LIST OF TOPICS
PRINT THIS ARTICLE
by Ron Walker
Lower peaks in the MACD histogram and rate of change reveal that momentum to the upside is beginning to wane for Starbucks, the largest coffee shop chain in the world, causing SBUX to undergo a test of its rising trendline and 20-day MA.
Position: N/A
Ron Walker
Ron Walker is an active trader and technical analyst. He operates an educational website dedicated to the study of Technical Analysis. The website offers free market analysis with daily video presentations and written commentaries. Ron is a video pioneer, being one of the first to utilize the internet producing Technical Analysis videos. His website is thechartpatterntrader.com
PRINT THIS ARTICLE
MOMENTUM
Starbucks Undergoes A Test
01/11/10 10:17:12 AMby Ron Walker
Lower peaks in the MACD histogram and rate of change reveal that momentum to the upside is beginning to wane for Starbucks, the largest coffee shop chain in the world, causing SBUX to undergo a test of its rising trendline and 20-day MA.
Position: N/A
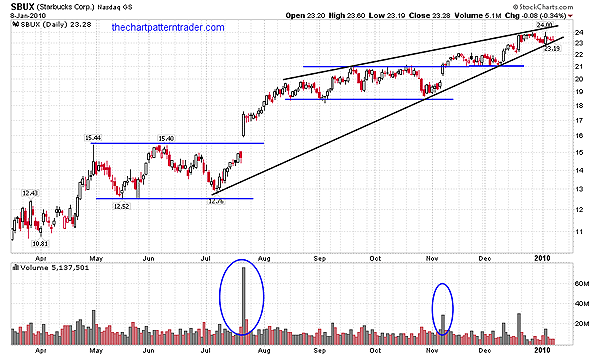
| In mid-July, Starbucks Corp. (SBUX) gapped up and out of a base that formed from May to early July (Figure 1). After that leg up, prices then consolidated into another base from August until early November. In late October, SBUX retraced the minor corrections that occurred in August and September to establish a solid level of support near $18. A few sessions after that, the test proved to be successful. SBUX successfully gapped up within the base, closing the session above it, managing to exceed the overhead resistance around $21. Note that both gaps in July and November caused SBUX to leap out of the congestion zones on heavy volume. |

|
| FIGURE 1: SBUX, DAILY. Gaps ignited SBUX to leap out of the congestion zones on heavy volume. Climbing prices eventually evolved into a bearish rising wedge chart pattern. |
| Graphic provided by: StockCharts.com. |
| |
| After clearing the $21 area, prices drifted back and walked on the tight rope of support until they ran into the rising trendline in early December. The intersection of horizontal support and a rising trendline lifted the coffee retailer to fresh highs near $24, double the price of the stock in just six months earlier. But in late December, SBUX had another minor correction that took it back to test the rising trendline from the July lows. That minor correction completed a huge bearish rising wedge pattern, going all the way back to July. |
| The minor correction is causing SBUX to test an important trendline. This trendline has proven itself to be very strong by connecting the lowest lows since July. If Starbucks breaks the trendline, it could begin the first stage of a 1-2-3 trend reversal popularized by Victor Sperandeo in his book Trader Vic: Methods Of A Wall Street Master. Sperandeo's 1-2-3 trend reversal is a simple method to determine whether the advance or decline has concluded. The "1" in the 1-2-3 trend reversal represents a broken trendline. The "2" is an initial test back to the preceding high or low in attempt to resume the previous trend. The "3" represents the final stage of the trend change, when prices break the minor low or move above high that was established at the break of the trendline. This final stage is the line in the sand that identifies and validates the trend change once it has completed. For a reversal to occur, SBUX needs to break the trend, followed by a failed rally that attempts to reassert the trend (the failed rally will usually produce a lower high). Once a lower high appears, prices need to turn back down and move beyond the low that was created after the trend broke. |

|
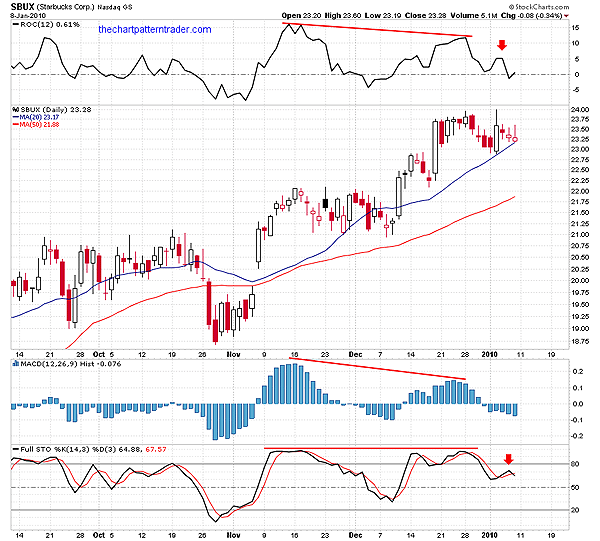
| FIGURE 2: SBUX, DAILY. Negative divergences in the ROC and MACDH anticipate weakness in SBUX as it tests its trendline (seen in Figure 1) and 20-day MA (blue line) while lower highs on the ROC and stochastic (red arrows) suggest a coming correction in the coffee retailer. |
| Graphic provided by: StockCharts.com. |
| |
| Besides the bearishness that is associated with the rising wedge pattern on the daily chart, there are some other valuable clues to help us determine whether the trendline will hold. Even though the trend hasn't changed, momentum is beginning to wane as prices test the trendline, suggesting future weakness. Figure 2 shows negative divergences on both the rate of change (ROC) (12) and the moving average convergence/divergence histogram (MACDH). While the stochastic (14, 3, 3) shows flat momentum going forward as it made equal peaks, the ROC looks to be in transition, undergoing a shift below the zero line, moving from positive to negative. Both the ROC and stochastic were followed by lower peaks, which developed after the bearish divergences appeared (red arrows in Figure 2). |
| Meanwhile, after the MACDH formed a lower pinnacle, it was followed by lower and lower readings that changed the slope of the vertical bars. The lower peak reveals that the bulls aren't as strong as they once were. The falling histogram bars have changed the slope of the histogram in the opposite direction of the trend, warning that the trend may no longer be safe. The lower histogram bars were ultimately dragged below zero line, suggesting that prices may embark on a new downtrend. Now, if prices do bounce off the trendline and the MACDH begins to turn and tick back up, the bulls will need plenty of caffeine in order to clear the upper boundary of the rising wedge in Figure 1. SBUX is not only testing an important trendline, but it is also sitting on its 20-day moving average (MA) as well (Figure 2). If prices break the trend and dip below the 20-day MA, it will offer additional evidence that momentum is shifting to the downside. |
Ron Walker is an active trader and technical analyst. He operates an educational website dedicated to the study of Technical Analysis. The website offers free market analysis with daily video presentations and written commentaries. Ron is a video pioneer, being one of the first to utilize the internet producing Technical Analysis videos. His website is thechartpatterntrader.com
| Website: | thechartpatterntrader.com |
| E-mail address: | thechartpatterntrader@gmail.com |
Click here for more information about our publications!
Comments
Date: 01/11/10Rank: 5Comment:
Date: 01/13/10Rank: 2Comment:

Request Information From Our Sponsors
- VectorVest, Inc.
- Executive Premier Workshop
- One-Day Options Course
- OptionsPro
- Retirement Income Workshop
- Sure-Fire Trading Systems (VectorVest, Inc.)
- Trading as a Business Workshop
- VectorVest 7 EOD
- VectorVest 7 RealTime/IntraDay
- VectorVest AutoTester
- VectorVest Educational Services
- VectorVest OnLine
- VectorVest Options Analyzer
- VectorVest ProGraphics v6.0
- VectorVest ProTrader 7
- VectorVest RealTime Derby Tool
- VectorVest Simulator
- VectorVest Variator
- VectorVest Watchdog
- StockCharts.com, Inc.
- Candle Patterns
- Candlestick Charting Explained
- Intermarket Technical Analysis
- John Murphy on Chart Analysis
- John Murphy's Chart Pattern Recognition
- John Murphy's Market Message
- MurphyExplainsMarketAnalysis-Intermarket Analysis
- MurphyExplainsMarketAnalysis-Visual Analysis
- StockCharts.com
- Technical Analysis of the Financial Markets
- The Visual Investor
