HOT TOPICS LIST
- MACD
- Fibonacci
- RSI
- Gann
- ADXR
- Stochastics
- Volume
- Triangles
- Futures
- Cycles
- Volatility
- ZIGZAG
- MESA
- Retracement
- Aroon
INDICATORS LIST
LIST OF TOPICS
PRINT THIS ARTICLE
by Eric Utley
The biggest of biotechs diverged from its sector recently. What's more interesting is the neutral triangle that was formed in the shares.
Position: N/A
Eric Utley
Eric Utley is a professional trader and contributing editor to www.OptionInvestor.com, a web-based newsletter that serves stock and options traders. While he cannot give investment advice, Eric welcomes your questions at eutley@optioninvestor.com.
PRINT THIS ARTICLE
ASCENDING TRIANGLES
Amgen's Triangle
11/21/01 11:25:20 AMby Eric Utley
The biggest of biotechs diverged from its sector recently. What's more interesting is the neutral triangle that was formed in the shares.
Position: N/A
| Amgen (Nasdaq:AMGN) is the world's largest biotech company. It recently traded with a market cap of $60 billion. Amgen is of course a component of the AMEX Biotechnology Index (BTK). The BTK is an equal dollar-weighted index. Each component is given an equal weighting irrespective of market cap. If the BTK were a market cap-weighted index it would not have performed as well recently thanks to Amgen. |
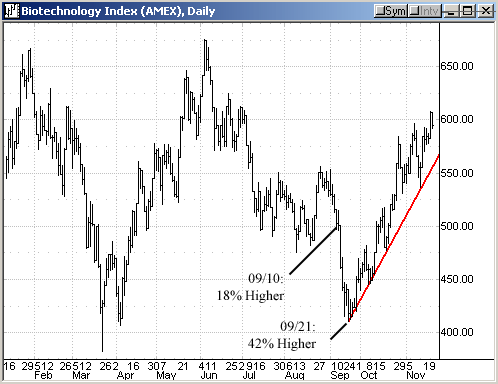
| The BTK is about 42 percent higher from its September 21 low. The sector is one of the best performing since the market hit bottom in late September. The BTK was recently led higher by components such as Gilead Science (Nasdaq:GILD), Human Genome (Nasdaq:HGSI), IDEC Pharmaceuticals (Nasdaq:IDPH), Immunex (Nasdaq:IMNX), Millennium Pharmaceuticals (Nasdaq:MLNM), and Protein Design Labs (Nasdaq:PDLI). The sector followed an aggressive ascending trendline and recently broke out above double-top resistance at 600. It currently trades above its early July levels. |

|
| Figure 1: Daily Chart for AMEX's Biotechnolgy Index. |
| Graphic provided by: Quote.com. |
| Graphic provided by: QCharts. |
| |
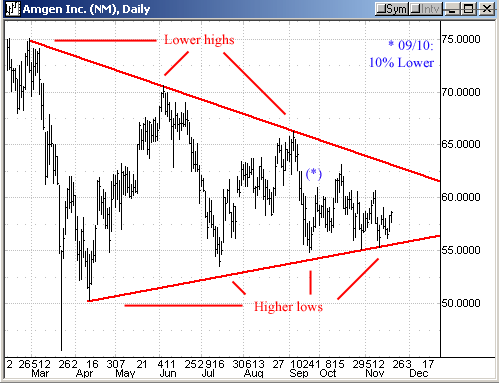
| The BTK is about 18 percent higher since September 10. Meanwhile, shares of Amgen are about 10 percent lower in the same period. One would think that the world's largest biotech company would be highly correlated with its sector, but that hasn't been the case. Indeed, Amgen diverged from the BTK by a wide margin. All the while, the stock lost a meaningful amount of relative strength versus the BTK. The cause for Amgen's divergence is unclear. The company is expected to grow earnings by about 18 percent next year, which is greater than the industry average of 16 percent. Among biotech concerns, Amgen's product mix is diversified and its pipeline deep. The company recently received regulatory approval for its rheumatoid arthritis drug, Kineret, and is expected to receive approval for its non-Hodgkin's lymphoma drug next year. On the surface, all is well. But price action never lies. |
| Not only has the stock diverged from its sector, but it traced a peculiar price pattern. The stock peaked in February at the $75 level, which is the current 52-week high. It then proceeded to sharply sell off to the $50 level and has been narrowing in range ever since. The coiling price is unmistakably a form of consolidation and may portend a large move in the next six months. With highs traced sequentially lower and lows sequentially higher most technicians would refer to Amgen's pattern as a neutral triangle, or wedge. However, the argument could be made that the greater slope of the resistance line gives the pattern a bearish bias.  Figure 2: Daily chart for AMGN. |
| Amgen's divergence from the BTK in conjunction with the formation of its wedge is most peculiar. Readers can draw their own conclusions. If the stock does break in one direction there are several strategies and means of execution to position trades ahead of any forthcoming move. The most simplistic of strategies would be to enter a directional position upon a breakout in either direction, using either the underlying or an option position; for example, buy the stock or a call on an advance past the upper-end of the wedge. Option traders could consider a straddle or strangle. Such a position would offer you less risk whereby the position is hedged. But the success of a straddle or strangle is predicated on a big move. If Amgen continues to trade sideways for an extended period, time decay would become a big risk to the buyer of a straddle or strangle. For the sake of decay, a straddle or strangle would be best executed near the apex of the triangle. In the case of the straddle, where you would purchase both the call and put with the same strike price and expiration, the preferred level to execute the position would be at $60 currently. Timing the purchase of the call below $60 and the purchase of the put above $60 would allow you to capture a spread, which would decrease risk and increase profit potential. Timing the entry of a strangle would create a similar result. The strangle, which is employed using an out-of-the-money call and an out-of-the-money put with the same expiration, would be less responsive to movement in the underlying initially, but would require less of a cash outlay. In both cases, using contracts that go out four or five months may be preferred, noting the duration that Amgen has traded in its triangle. At the time of publication Eric held no positions in any securities mentioned, although holdings can change at any time. |
Eric Utley is a professional trader and contributing editor to www.OptionInvestor.com, a web-based newsletter that serves stock and options traders. While he cannot give investment advice, Eric welcomes your questions at eutley@optioninvestor.com.
| Title: | Contributing Editor |
| Company: | OptionInvestor.com |
| Website: | www.OptionInvestor.com |
| E-mail address: | eutley@optioninvestor.com |
Traders' Resource Links | |
| OptionInvestor.com has not added any product or service information to TRADERS' RESOURCE. | |
Click here for more information about our publications!
Comments
Date: 11/27/01Rank: 3Comment:
Date: 12/05/01Rank: 4Comment:

Request Information From Our Sponsors
- StockCharts.com, Inc.
- Candle Patterns
- Candlestick Charting Explained
- Intermarket Technical Analysis
- John Murphy on Chart Analysis
- John Murphy's Chart Pattern Recognition
- John Murphy's Market Message
- MurphyExplainsMarketAnalysis-Intermarket Analysis
- MurphyExplainsMarketAnalysis-Visual Analysis
- StockCharts.com
- Technical Analysis of the Financial Markets
- The Visual Investor
- VectorVest, Inc.
- Executive Premier Workshop
- One-Day Options Course
- OptionsPro
- Retirement Income Workshop
- Sure-Fire Trading Systems (VectorVest, Inc.)
- Trading as a Business Workshop
- VectorVest 7 EOD
- VectorVest 7 RealTime/IntraDay
- VectorVest AutoTester
- VectorVest Educational Services
- VectorVest OnLine
- VectorVest Options Analyzer
- VectorVest ProGraphics v6.0
- VectorVest ProTrader 7
- VectorVest RealTime Derby Tool
- VectorVest Simulator
- VectorVest Variator
- VectorVest Watchdog
