

HOT TOPICS LIST
- MACD
- Fibonacci
- RSI
- Gann
- ADXR
- Stochastics
- Volume
- Triangles
- Futures
- Cycles
- Volatility
- ZIGZAG
- MESA
- Retracement
- Aroon
INDICATORS LIST
LIST OF TOPICS
PRINT THIS ARTICLE
by Chaitali Mohile
The near-term target for the Dow Jones Industrial Average is a few hundred points away from current levels. But the exhausted technical conditions on the charts might discourage a speedy rally.
Position: Hold
Chaitali Mohile
Active trader in the Indian stock markets since 2003 and a full-time writer. Trading is largely based upon technical analysis.
PRINT THIS ARTICLE
TECHNICAL INDICATORS
Bullish But Volatile Road For DJIA
01/08/10 10:29:22 AMby Chaitali Mohile
The near-term target for the Dow Jones Industrial Average is a few hundred points away from current levels. But the exhausted technical conditions on the charts might discourage a speedy rally.
Position: Hold
| In my 11/12/09 article, I mentioned the targets for the Dow Jones Industrial Average ($INDU) using the Fibonacci retracement and the moving average (MA). Currently, the targets of 11000 and 11200 are unchanged, but the conditions on the technical charts are different. On the weekly chart in Figure 1, $INDU has moved vertically upward after the breakout at 9000 levels. The breakout reversed a robust downtrend and generated bullish sentiments in the market. The full stochastic (14,3,3) surged to an overbought zone and the moving average convergence/divergence (MACD) (12,26,9) shifted into positive territory. Both the indicators indicated positive momentum in the new bullish rally. |
| Gradually, $INDU moved higher, forming a rising wedge. The wedge was confirmed by declining volume. The rising wedge is a bearish reversal formation that breaks in a downward direction. However, the formation in Figure 1 has not reached its maturity point to undergo a bearish breakout. The lower trendline of the wedge is not challenged and the average directional movement index (ADX) (14) is indicating a developing uptrend at 25 levels. The stochastic oscillator has been moving horizontally, suggesting a significant momentum in the rally. The index has moved towards its near-term target of the 200-day moving average (MA) at 11181. Therefore, a bearish breakout is currently not indicated on the chart. |
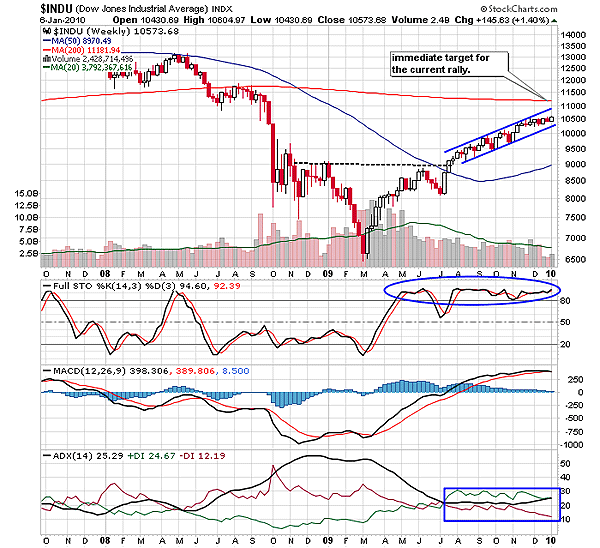
|
| FIGURE 1: $INDU, WEEKLY. The vertical price rally has formed the rising wedge pattern. The indicators are not completely bearish to initiate the downward breakout rally. |
| Graphic provided by: StockCharts.com. |
| |
| The indicators have not turned completely bearish, and neither they are robustly bullish. The rally has equal buying and selling pressure, which could lead to a slowdown in the existing rally or even a consolidation. The MACD (12,26,9) has merged with the trigger line, suggesting declining momentum. Therefore, $INDU is likely to take baby steps in heading toward the 200-day MA resistance. |
|
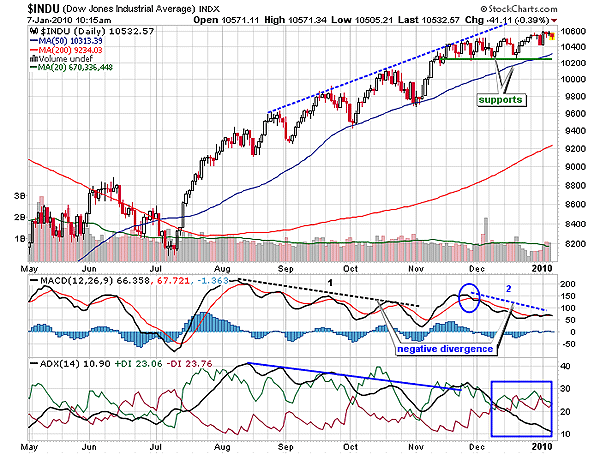
| FIGURE 2: $INDU, DAILY. The lower consolidation range and the 50-day MA are the two important supports for $INDU. |
| Graphic provided by: StockCharts.com. |
| |
| The weakness in the trend indicator on the daily chart in Figure 2 added sluggishness to the rally. According to the ADX (14) on the chart, the uptrend for $INDU developed in July 2009, initiating a fresh bullish rally from 8400 levels. However, the well-developed uptrend could not sustain for a longer time as the ADX (14) began declining from an overheated region in August 2009. Additional volatility was induced by the first negative divergence shown by the black dotted line of MACD (12,26,9) in Figure 2. Since August 2009, the momentum indicator is forming a series of the lower highs. The index turned range-bound after hitting 10200 levels. The lower range of the consolidation and the 50-day MA established strong support for $INDU. While the index consolidated at another higher level, however, the lower high appeared on MACD (12,26,9). Thus, another negative divergence (see the blue line) in Figure 2 is likely to affect the further growth on the rally. |
| The high volatility and weak trend would decelerate the speed for achieving the target. In case of any corrective rally, the lower range at 10200 and the 50-day MA would offer essential support. Thus, the technical changes on both charts of $INDU would discourage the existing bull run. |
Active trader in the Indian stock markets since 2003 and a full-time writer. Trading is largely based upon technical analysis.
| Company: | Independent |
| Address: | C1/3 Parth Indraprasth Towers. Vastrapur |
| Ahmedabad, Guj 380015 | |
| E-mail address: | chaitalimohile@yahoo.co.in |
Traders' Resource Links | |
| Independent has not added any product or service information to TRADERS' RESOURCE. | |
Click here for more information about our publications!
PRINT THIS ARTICLE

Request Information From Our Sponsors
- StockCharts.com, Inc.
- Candle Patterns
- Candlestick Charting Explained
- Intermarket Technical Analysis
- John Murphy on Chart Analysis
- John Murphy's Chart Pattern Recognition
- John Murphy's Market Message
- MurphyExplainsMarketAnalysis-Intermarket Analysis
- MurphyExplainsMarketAnalysis-Visual Analysis
- StockCharts.com
- Technical Analysis of the Financial Markets
- The Visual Investor
- VectorVest, Inc.
- Executive Premier Workshop
- One-Day Options Course
- OptionsPro
- Retirement Income Workshop
- Sure-Fire Trading Systems (VectorVest, Inc.)
- Trading as a Business Workshop
- VectorVest 7 EOD
- VectorVest 7 RealTime/IntraDay
- VectorVest AutoTester
- VectorVest Educational Services
- VectorVest OnLine
- VectorVest Options Analyzer
- VectorVest ProGraphics v6.0
- VectorVest ProTrader 7
- VectorVest RealTime Derby Tool
- VectorVest Simulator
- VectorVest Variator
- VectorVest Watchdog