HOT TOPICS LIST
- MACD
- Fibonacci
- RSI
- Gann
- ADXR
- Stochastics
- Volume
- Triangles
- Futures
- Cycles
- Volatility
- ZIGZAG
- MESA
- Retracement
- Aroon
INDICATORS LIST
LIST OF TOPICS
PRINT THIS ARTICLE
by Koos van der Merwe
Atmel Corp,, founded in 1984, is a worldwide leader in the design, manufacturing and marketing of advanced semiconductors -- so why is it going so strong right now?
Position: Sell
Koos van der Merwe
Has been a technical analyst since 1969, and has worked as a futures and options trader with First Financial Futures in Johannesburg, South Africa.
PRINT THIS ARTICLE
TREND-CHANNEL
Why Is Atmel Coming On So Strong?
01/06/10 01:05:37 PMby Koos van der Merwe
Atmel Corp,, founded in 1984, is a worldwide leader in the design, manufacturing and marketing of advanced semiconductors -- so why is it going so strong right now?
Position: Sell
| Why has Atmel (ATML) come up so strong in my analysis? Is someone looking to take them over, or are they selling assets to improve their business model? |

|
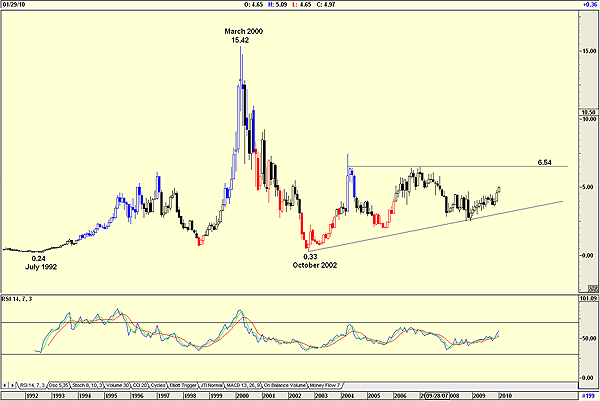
| FIGURE 1: ATML, MONTHLY |
| Graphic provided by: AdvancedGET. |
| |
| Whatever the reason, the charts are worth following. Figure 1 is a monthly and shows how the stock price rose with the dotcom boom from a low of $0.24 in July 1992 to a high of $15.42 by March 2000. From that date, with the bursting of the bubble, the price collapsed to $0.33 by October 2002. Since then, the price has recovered to form a resistance level and possible target at $6.54. With the price currently at $4.97, the stock does look interesting. |

|
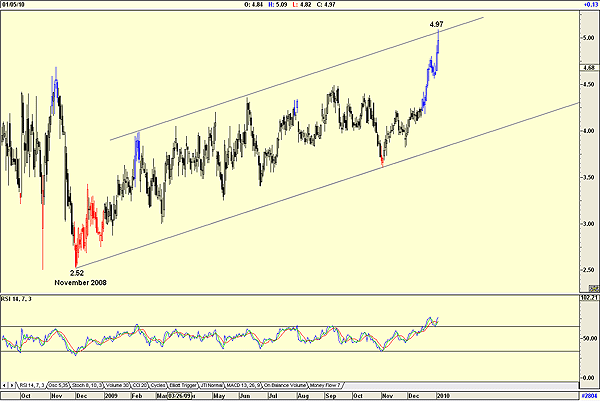
| FIGURE 2: ATML, DAILY |
| Graphic provided by: AdvancedGET. |
| |
| Figure 2, a daily chart, shows how the price has risen with numerous corrections to its present price of $4.97. Unlike the monthly chart (Figure 1), which is suggesting strength, the daily chart has reached a resistance level at $4.97. The relative strength index (RSI) is confirming this and is overbought at present levels. Although the chart looks interesting for the short term, and especially in divesting itself of certain assets to improve its balance sheet, the stock is not a buy but could be placed on your watchlist. |
Has been a technical analyst since 1969, and has worked as a futures and options trader with First Financial Futures in Johannesburg, South Africa.
| Address: | 3256 West 24th Ave |
| Vancouver, BC | |
| Phone # for sales: | 6042634214 |
| E-mail address: | petroosp@gmail.com |
Click here for more information about our publications!
PRINT THIS ARTICLE

Request Information From Our Sponsors
- StockCharts.com, Inc.
- Candle Patterns
- Candlestick Charting Explained
- Intermarket Technical Analysis
- John Murphy on Chart Analysis
- John Murphy's Chart Pattern Recognition
- John Murphy's Market Message
- MurphyExplainsMarketAnalysis-Intermarket Analysis
- MurphyExplainsMarketAnalysis-Visual Analysis
- StockCharts.com
- Technical Analysis of the Financial Markets
- The Visual Investor
- VectorVest, Inc.
- Executive Premier Workshop
- One-Day Options Course
- OptionsPro
- Retirement Income Workshop
- Sure-Fire Trading Systems (VectorVest, Inc.)
- Trading as a Business Workshop
- VectorVest 7 EOD
- VectorVest 7 RealTime/IntraDay
- VectorVest AutoTester
- VectorVest Educational Services
- VectorVest OnLine
- VectorVest Options Analyzer
- VectorVest ProGraphics v6.0
- VectorVest ProTrader 7
- VectorVest RealTime Derby Tool
- VectorVest Simulator
- VectorVest Variator
- VectorVest Watchdog
