HOT TOPICS LIST
- MACD
- Fibonacci
- RSI
- Gann
- ADXR
- Stochastics
- Volume
- Triangles
- Futures
- Cycles
- Volatility
- ZIGZAG
- MESA
- Retracement
- Aroon
INDICATORS LIST
LIST OF TOPICS
PRINT THIS ARTICLE
by Alan R. Northam
According to the pitchfork formation that Alan Hall Andrews became famous for, the S&P 500 will be reaching higher highs — for the moment.
Position: N/A
Alan R. Northam
Alan Northam lives in the Dallas, Texas area and as an electronic engineer gave him an analytical mind from which he has developed a thorough knowledge of stock market technical analysis. His abilities to analyze the future direction of the stock market has allowed him to successfully trade of his own portfolio over the last 30 years. Mr. Northam is now retired and trading the stock market full time. You can reach him at inquiry@tradersclassroom.com or by visiting his website at http://www.tradersclassroom.com. You can also follow him on Twitter @TradersClassrm.
PRINT THIS ARTICLE
ANDREWS PITCH-FORK
Andrews Pitchfork Predicts Higher Trend -- For Now
01/06/10 09:33:55 AMby Alan R. Northam
According to the pitchfork formation that Alan Hall Andrews became famous for, the S&P 500 will be reaching higher highs — for the moment.
Position: N/A
| Once Alan Andrews identified the significant pivot points on the chart he was studying, he would draw his pitchfork. (See my article entitled "Significant Pivot Points Determine Trend," published on January 5, 2010, for details.) There were two main ways Andrews would draw his pitchfork. When he identified the first three significant pivot points, he would draw his pitchfork from P0 to P1 and to P2. However, as the trend further developed and significant pivot points P3 and P4 were identified, he would draw a new pitchfork from P2 to P3 and to P4. Andrews believed that using this second method of drawing his pitchfork helped him better identify the area in which the final P5 pivot point would form. |
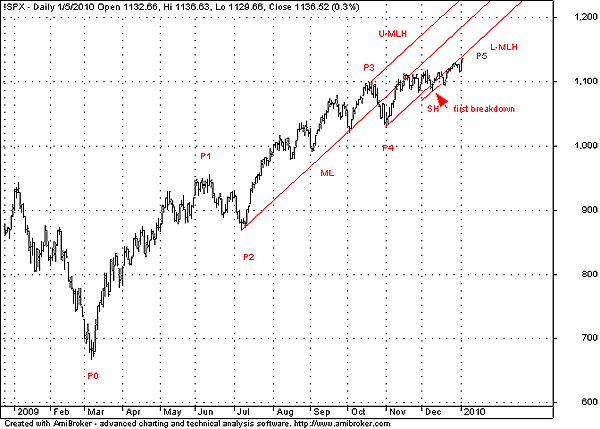
| Figure 1 shows this second method of drawing the Andrews pitchfork. Alan Andrews noted that 80% of the time when price reached the median line, labeled ML on the chart, the price would reverse direction, forming P5. Note that in Figure 1 the price did reach the median line after forming significant pivot point P4. Instead of reversing direction and completing the final P5 pivot point, however, the market moved sideways, running into support from the lower line of the pitchfork, labeled "L-MLH" (which stands for "lower median line horizontal," which was Andrews' way of referencing the lower line that was horizontal or parallel to the median line [ML]). |

|
| FIGURE 1: S&P 500, DAILY. Here's the Andrews pitchfork and the sliding horizontal line. |
| Graphic provided by: AmiBroker.com. |
| |
| Figure 1 also shows that upon reaching the L-MLH, price broke down through it. When this occurred, Andrews would draw a line parallel to the median line (ML) and at the low of the first bar that broke down below the L-MLH. He labeled this line as "SH," for "sliding horizontal." The SH line is a reversal indicator. If price then broke down below the SH line, a reversal signal was given. However, if price did not break down below the SH line within two or three days, Andrews then expected price to continue upward along the L-MLH. From Figure 1 we can see that this is exactly what transpired. The price did not break down below the SH line within two or three days as expected, and the market continued upward along the L-MLH. |
| In conclusion, the final pivot point P5 was expected to form just after the completion of P4 when price first traded up to the median line (ML). However, after bouncing off the sliding horizontal line (SH) and not breaking down below it within the next two or three days, it became obvious that the S&P 500 had further to go on the upside before completing its upward trend. |
Alan Northam lives in the Dallas, Texas area and as an electronic engineer gave him an analytical mind from which he has developed a thorough knowledge of stock market technical analysis. His abilities to analyze the future direction of the stock market has allowed him to successfully trade of his own portfolio over the last 30 years. Mr. Northam is now retired and trading the stock market full time. You can reach him at inquiry@tradersclassroom.com or by visiting his website at http://www.tradersclassroom.com. You can also follow him on Twitter @TradersClassrm.
| Garland, Tx | |
| Website: | www.tradersclassroom.com |
| E-mail address: | inquiry@tradersclassroom.com |
Click here for more information about our publications!
Comments

Request Information From Our Sponsors
- VectorVest, Inc.
- Executive Premier Workshop
- One-Day Options Course
- OptionsPro
- Retirement Income Workshop
- Sure-Fire Trading Systems (VectorVest, Inc.)
- Trading as a Business Workshop
- VectorVest 7 EOD
- VectorVest 7 RealTime/IntraDay
- VectorVest AutoTester
- VectorVest Educational Services
- VectorVest OnLine
- VectorVest Options Analyzer
- VectorVest ProGraphics v6.0
- VectorVest ProTrader 7
- VectorVest RealTime Derby Tool
- VectorVest Simulator
- VectorVest Variator
- VectorVest Watchdog
- StockCharts.com, Inc.
- Candle Patterns
- Candlestick Charting Explained
- Intermarket Technical Analysis
- John Murphy on Chart Analysis
- John Murphy's Chart Pattern Recognition
- John Murphy's Market Message
- MurphyExplainsMarketAnalysis-Intermarket Analysis
- MurphyExplainsMarketAnalysis-Visual Analysis
- StockCharts.com
- Technical Analysis of the Financial Markets
- The Visual Investor
