HOT TOPICS LIST
- MACD
- Fibonacci
- RSI
- Gann
- ADXR
- Stochastics
- Volume
- Triangles
- Futures
- Cycles
- Volatility
- ZIGZAG
- MESA
- Retracement
- Aroon
INDICATORS LIST
LIST OF TOPICS
PRINT THIS ARTICLE
by Austin Passamonte
Is the technology sector staging a bear market rally?
Position: N/A
Austin Passamonte
Austin is a private trader who trades emini stock index futures intraday. He currently trades various futures markets from home in addition to managing a trader's educational forum
PRINT THIS ARTICLE
INDEX OPTION TRADING
Techs Are Strong, Relatively Speaking
11/20/01 11:40:30 AMby Austin Passamonte
Is the technology sector staging a bear market rally?
Position: N/A
| Earlier charting has shown that the Dow Industrial Average and various component sectors are staging a battle against resistance. They first enjoyed quick bursts early in the recent rally but now find themselves leaking a bit of capital as sector rotation evolves. Where might that money be going? |
| Even when the Dow and S&P indexes managed to stage bear market rallies this year and last, the Nasdaq 100 languished behind. It rallied less and sold off more than the old economy issues, relatively speaking. Now we could see changes in the wind, or at least technical chart indications. |

|
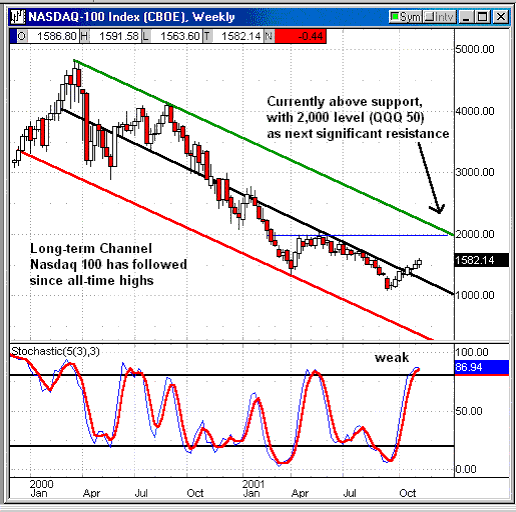
| Figure 1: Weekly chart of the Nasdaq 100 Index. Both the long-term trend channel and the next level of significant resistance are around the 2,000 mark. |
| Graphic provided by: Quote.com. |
| Graphic provided by: QCharts. |
| |
| This weekly view of the NDX show a clear and dominant descending channel almost two year's in age dating back to December 1999. Since October of 2000 we saw price action dip below the median value line (black) and never break above for one full year until late September 2001. By no means does this assure the end of a bear market in techs, but that is quite a feat of strength in relation to the past year's behavior. Double trouble of resistance lies up near the NDX 2,000 (QQQ 50) area, but first things first. We'll watch that middle trendline for support and eye overhead resistance as it approaches in the future. |
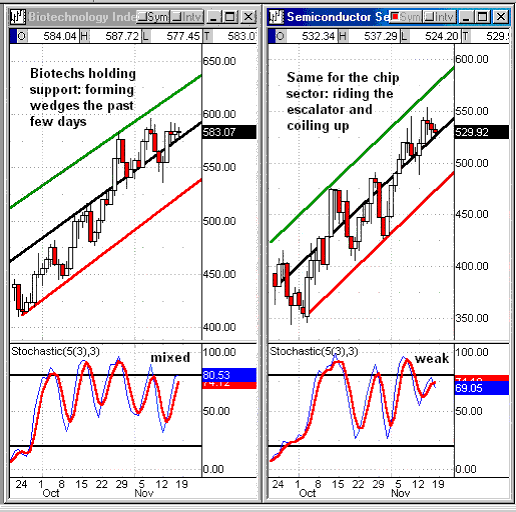
 Figure 2: Daily charts of the biotech (BTK, left) and semi-conductor (SOX, right) indices. A peek at the two leading sectors for the major index shows biotech (BTK, left) and semi-conductor (SOX, right) in clear ascending channels of their own. This was obviously expected-- How else could the broad index trend if its major sectors didn't? Both have based on support the past few sessions and lower highs indicate price action is coiling into wedges that signal the next directional move. With stochastic values mixed to weak at best, a pullback that holds near red lines of support while oscillators cycle back down towards oversold extreme could be the next high-odds bullish targets to seek. It's been so long since we've traded a sustained rally, most of us almost forgot how. Many who mastered waiting for dips to buy plied that tactic too many times from 2000 forward and no longer play our game. It goes without saying that each day in the market is not an ideal entry to take, but ideal entries will come along one day soon! |
Austin is a private trader who trades emini stock index futures intraday. He currently trades various futures markets from home in addition to managing a trader's educational forum
| Title: | Individual Trader |
| Company: | CoiledMarkets.com |
| Address: | PO Box 633 |
| Naples, NY 14512 | |
| Website: | coiledmarkets.com/blog |
| E-mail address: | austinp44@yahoo.com |
Traders' Resource Links | |
| CoiledMarkets.com has not added any product or service information to TRADERS' RESOURCE. | |
Click here for more information about our publications!
Comments
Date: 11/21/01Rank: 4Comment:

Request Information From Our Sponsors
- StockCharts.com, Inc.
- Candle Patterns
- Candlestick Charting Explained
- Intermarket Technical Analysis
- John Murphy on Chart Analysis
- John Murphy's Chart Pattern Recognition
- John Murphy's Market Message
- MurphyExplainsMarketAnalysis-Intermarket Analysis
- MurphyExplainsMarketAnalysis-Visual Analysis
- StockCharts.com
- Technical Analysis of the Financial Markets
- The Visual Investor
- VectorVest, Inc.
- Executive Premier Workshop
- One-Day Options Course
- OptionsPro
- Retirement Income Workshop
- Sure-Fire Trading Systems (VectorVest, Inc.)
- Trading as a Business Workshop
- VectorVest 7 EOD
- VectorVest 7 RealTime/IntraDay
- VectorVest AutoTester
- VectorVest Educational Services
- VectorVest OnLine
- VectorVest Options Analyzer
- VectorVest ProGraphics v6.0
- VectorVest ProTrader 7
- VectorVest RealTime Derby Tool
- VectorVest Simulator
- VectorVest Variator
- VectorVest Watchdog
