HOT TOPICS LIST
- MACD
- Fibonacci
- RSI
- Gann
- ADXR
- Stochastics
- Volume
- Triangles
- Futures
- Cycles
- Volatility
- ZIGZAG
- MESA
- Retracement
- Aroon
INDICATORS LIST
LIST OF TOPICS
PRINT THIS ARTICLE
by Chaitali Mohile
The long consolidation period for the Utilities Select Sector SPDR ended with a robust breakout. But a breakout rally is likely to come under threat.
Position: N/A
Chaitali Mohile
Active trader in the Indian stock markets since 2003 and a full-time writer. Trading is largely based upon technical analysis.
PRINT THIS ARTICLE
TECHNICAL ANALYSIS
XLU Under Pressure
12/22/09 08:58:00 AMby Chaitali Mohile
The long consolidation period for the Utilities Select Sector SPDR ended with a robust breakout. But a breakout rally is likely to come under threat.
Position: N/A
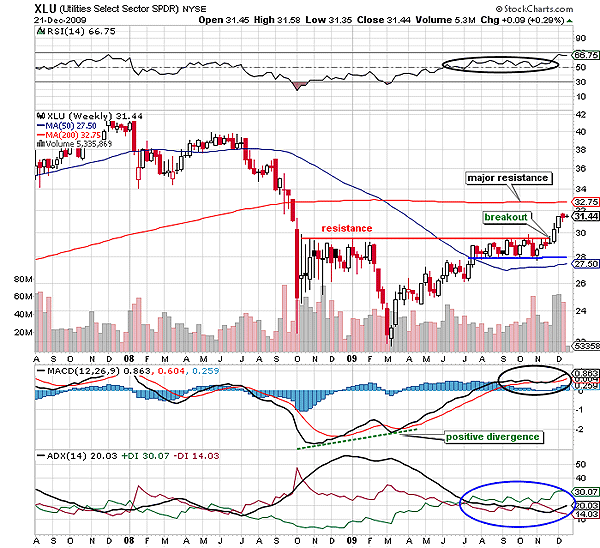
| An upper range of a triangular formation (2008) restricted the bullish rally of the Utilities Select Sector SPDR (XLU) in 2009. The bearish breakout of the triangular pattern plunged XLU to the lowest level at 22. The pullback rally from the new low erupted due to an overheated downtrend reflected by the average directional movement index (ADX) (14) and the highly oversold relative strength index (RSI) (14). Both indicators suggested a trend reversal rally. In addition, the moving average convergence/divergence (MACD) (12,26,9) showed strong positive divergence by forming higher bottoms. Therefore, the rally began on the robust bullish notes, hitting a first trading resistance near 28 levels. |

|
| FIGURE 1: XLU, WEEKLY. The weak indicators and an immediate resistance of the 200-day MA have suppressed the breakout rally. |
| Graphic provided by: StockCharts.com. |
| |
| Since July 2009, XLU has been struggling in a narrow range between 28 and 30. Generally, we believe that the consolidation after a rally induces the required strength for the future rally. But if the consolidation continues for more than four to six weeks, the stock turns weaker, thus affecting the breakout. In Figure 1, XLU has been consolidating for more than three months; therefore, the breakout was likely to be weaker. But as we can see on the weekly chart, the breakout was accompanied by strong volume for almost two weeks. The two white candles show bullishness in the rally. Meanwhile, the RSI (14) that was shaky near the center line (50 level) surged to 60, indicating marginal bullish strength in the breakout. The MACD (12,26,9), however, is positive that the indicator is not completely bullish to generate a fresh momentum for XLU. Currently, the ADX (14) is indicating a developing uptrend. |
| Therefore, all three indicators are lacking the robust bullish force to pull XLU toward its long-term moving average (MA) resistance, the 200-day MA. The stock is likely to get highly volatile due to the weak indicators and the moving average resistance. The daredevils can grab a trade between the support and resistance of 30 and 32 levels, respectively. XLU would remain under pressure till the strong uptrend is developed and the fresh bullish strength got generated. |
Active trader in the Indian stock markets since 2003 and a full-time writer. Trading is largely based upon technical analysis.
| Company: | Independent |
| Address: | C1/3 Parth Indraprasth Towers. Vastrapur |
| Ahmedabad, Guj 380015 | |
| E-mail address: | chaitalimohile@yahoo.co.in |
Traders' Resource Links | |
| Independent has not added any product or service information to TRADERS' RESOURCE. | |
Click here for more information about our publications!
Comments
Date: 12/22/09Rank: 2Comment:

Request Information From Our Sponsors
- StockCharts.com, Inc.
- Candle Patterns
- Candlestick Charting Explained
- Intermarket Technical Analysis
- John Murphy on Chart Analysis
- John Murphy's Chart Pattern Recognition
- John Murphy's Market Message
- MurphyExplainsMarketAnalysis-Intermarket Analysis
- MurphyExplainsMarketAnalysis-Visual Analysis
- StockCharts.com
- Technical Analysis of the Financial Markets
- The Visual Investor
- VectorVest, Inc.
- Executive Premier Workshop
- One-Day Options Course
- OptionsPro
- Retirement Income Workshop
- Sure-Fire Trading Systems (VectorVest, Inc.)
- Trading as a Business Workshop
- VectorVest 7 EOD
- VectorVest 7 RealTime/IntraDay
- VectorVest AutoTester
- VectorVest Educational Services
- VectorVest OnLine
- VectorVest Options Analyzer
- VectorVest ProGraphics v6.0
- VectorVest ProTrader 7
- VectorVest RealTime Derby Tool
- VectorVest Simulator
- VectorVest Variator
- VectorVest Watchdog
