HOT TOPICS LIST
- MACD
- Fibonacci
- RSI
- Gann
- ADXR
- Stochastics
- Volume
- Triangles
- Futures
- Cycles
- Volatility
- ZIGZAG
- MESA
- Retracement
- Aroon
INDICATORS LIST
LIST OF TOPICS
PRINT THIS ARTICLE
by Donald W. Pendergast, Jr.
Two noteworthy trading systems have flashed simultaneous sell signals in March 2010 soybeans. Is this a trade setup worthy of consideration?
Position: Sell
Donald W. Pendergast, Jr.
Donald W. Pendergast is a financial markets consultant who offers specialized services to stock brokers and high net worth individuals who seek a better bottom line for their portfolios.
PRINT THIS ARTICLE
TRADING SYSTEMS
Several Systems Agree -- Short March Soybeans
12/21/09 01:08:13 PMby Donald W. Pendergast, Jr.
Two noteworthy trading systems have flashed simultaneous sell signals in March 2010 soybeans. Is this a trade setup worthy of consideration?
Position: Sell
| Soybeans appear to have completed a bullish move, one that began in early October 2009, but with two unique trading systems now flashing a thumbs-down sign, shrewd traders will want to do some further seasonal and technical examination in this extremely liquid futures market. |

|
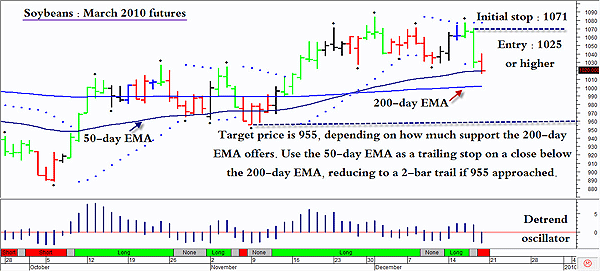
| FIGURE 1: SOYBEANS, MARCH. Overall, the balance of technical and fundamentals affecting this grain market appear to favor a continuation of the current down swing. Watch the price action near the 200-day EMA for further clues as to the strength of this move. |
| Graphic provided by: MetaStock. |
| Graphic provided by: WB Detrend RT EOD from ProfitTrader for MetaStock. |
| |
| In Figure 1, one displaying a custom-made parabolic stop and reverse (ParaSar) system and key moving averages, normally, I would bypass this particular signal since we're a day late. However, this short signal has a lot of (bearish) complementary technical and fundamental firepower backing it up: 1. The weekly price cycle (not shown) is in a confirmed down mode. 2. Price has closed beneath the 50-week exponential moving average (EMA). 3. The 15-year seasonal chart suggests that soybeans usually make an interim top in the last half of December before moving lower throughout January. 4. The RMO (Rahul Mohindar) trading system has also issued a new short signal for March soybeans. 5. Current COT figures suggest that soybeans are also poised for a pullback, as commercials have begun to lighten up on net short positions. Remember, the commercial interests build their positions over time, scaling in by buying more and more as the price moves lower, so this could be a precursor to a modest to significant down move in soybeans. |

|
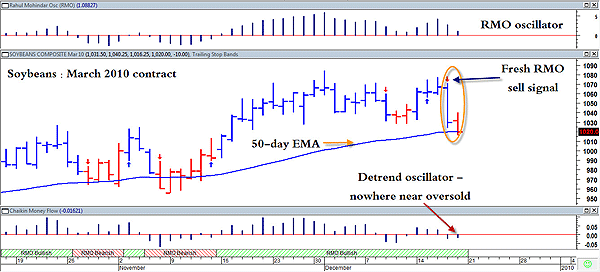
| FIGURE 2: SOYBEANS, MARCH. Two for the money? Both the ParaSar and RMO trading systems have recently flashed short sell signals in March beans. Note the range of the price bar generating the signal, a mildly bearish confirmation. |
| Graphic provided by: MetaStock. |
| Graphic provided by: Rahul Mohindar indicators from MetaStock v.11. |
| |
| Here's Figure 2, the RMO short signal chart in March beans. Even though the RMO oscillator (top of chart) is still above its zero line, given the overwhelmingly bearish mix of fundamental and technical matters previously discussed, this doesn't really amount to anything that would nix this particular setup. So what's the risk-to-reward ratio (RR) for this setup, anyway? |
| Since a bounce higher off of the daily 50-day EMA is a possibility, using Friday's high at 1041 for the initial stop might be a bit too close, leaving us with Thursday's high near 1071 as the only other sane alternative. In addition, if you see a daily bounce higher toward 1025 to 1030 (or better), entering your short position there will provide this trade with a greatly enhanced RR. The logical profit target is about 955 (the November swing low), meaning that this trade has a RR of about 1.8 to 1 given a short entry at 1029, an initial stop at 1071, and a profit target of 955. To manage this trade, here are a few tips that might help: Say you enter short on a bounce back up to 1028 and have set your initial stop at 1071.25. If the trade moves south, closing beneath the 200-day EMA (see Figure 1), move your stop down to one tick above the price of the 50-day EMA, whatever its value is at that time. Then if the trade really lets loose, moving down toward 970, start running a two-bar trailing stop of the daily highs. If you're a one-lot trader, seriously consider closing the trade out anywhere between 960 and 955, as a bounce higher from 955 is a real likelihood. Two-lot (or greater) traders might close out at least one contract in that price zone, continuing to run the two-bar trail on the remaining contracts. |
| This particular short trade is best suited for experienced commodity traders who have a healthy margin account. If that describes you, then give this setup some serious thought, as most major factors that affect this market are all suggesting that some sort of a tradable correction is currently in the works. |
Donald W. Pendergast is a financial markets consultant who offers specialized services to stock brokers and high net worth individuals who seek a better bottom line for their portfolios.
| Title: | Writer, market consultant |
| Company: | Linear Trading Systems LLC |
| Jacksonville, FL 32217 | |
| Phone # for sales: | 904-239-9564 |
| E-mail address: | lineartradingsys@gmail.com |
Traders' Resource Links | |
| Linear Trading Systems LLC has not added any product or service information to TRADERS' RESOURCE. | |
Click here for more information about our publications!
Comments
Date: 12/21/09Rank: 4Comment:

Request Information From Our Sponsors
- StockCharts.com, Inc.
- Candle Patterns
- Candlestick Charting Explained
- Intermarket Technical Analysis
- John Murphy on Chart Analysis
- John Murphy's Chart Pattern Recognition
- John Murphy's Market Message
- MurphyExplainsMarketAnalysis-Intermarket Analysis
- MurphyExplainsMarketAnalysis-Visual Analysis
- StockCharts.com
- Technical Analysis of the Financial Markets
- The Visual Investor
- VectorVest, Inc.
- Executive Premier Workshop
- One-Day Options Course
- OptionsPro
- Retirement Income Workshop
- Sure-Fire Trading Systems (VectorVest, Inc.)
- Trading as a Business Workshop
- VectorVest 7 EOD
- VectorVest 7 RealTime/IntraDay
- VectorVest AutoTester
- VectorVest Educational Services
- VectorVest OnLine
- VectorVest Options Analyzer
- VectorVest ProGraphics v6.0
- VectorVest ProTrader 7
- VectorVest RealTime Derby Tool
- VectorVest Simulator
- VectorVest Variator
- VectorVest Watchdog
