HOT TOPICS LIST
- MACD
- Fibonacci
- RSI
- Gann
- ADXR
- Stochastics
- Volume
- Triangles
- Futures
- Cycles
- Volatility
- ZIGZAG
- MESA
- Retracement
- Aroon
INDICATORS LIST
LIST OF TOPICS
PRINT THIS ARTICLE
by Mike Carr, CMT
Momentum has shifted in the dollar and points to the next big move being up.
Position: N/A
Mike Carr, CMT
Mike Carr, CMT, is a member of the Market Technicians Association, and editor of the MTA's newsletter, Technically Speaking. He is also the author of "Smarter Investing in Any Economy: The Definitive Guide to Relative Strength Investing," and "Conquering the Divide: How to Use Economic Indicators to Catch Stock Market Trends."
PRINT THIS ARTICLE
STRATEGIES
Dollar Heading Higher?
12/17/09 10:16:07 AMby Mike Carr, CMT
Momentum has shifted in the dollar and points to the next big move being up.
Position: N/A
| The dollar is prone to volatility. It also trends nicely and although this may sound contradictory, it really means that maximum risk is associated with the greatest possible returns. Spotting trend changes can be difficult but obviously rewarding. |
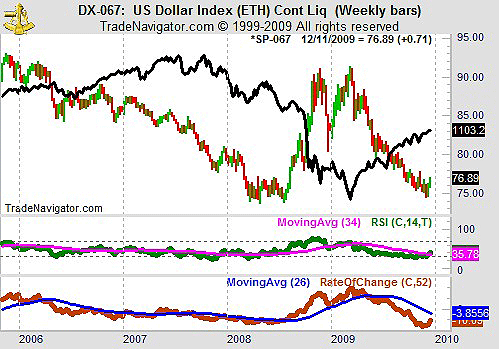
| Momentum is a commonly employed technical tool. It is commonly believed that changes in momentum precede changes in price. We can see in Figure 1 that momentum in the dollar index has turned higher. The relative strength index (RSI) has broken above its long-term moving average (34 periods is used in the moving average simply because it is long term and is a Fibonacci number). The 52-week rate of change has turned higher. |

|
| FIGURE 1: DX-067, WEEKLY. The weekly chart of the US Dollar Index is showing a breakout to the upside in RSI and ROC indicators. |
| Graphic provided by: Trade Navigator. |
| |
| These bullish developments come with two tradable insights. First, we may see the dollar stall when the rate of change approaches its 26-week moving average. This line has served as both resistance and support in the past and is worth watching. |
| The solid line shown with the bar chart of the dollar is the Standard & Poor's 500. The dollar and this stock market index have been moving in opposite directions for some time. That is our second insight that it might be time for stocks to slow, or reverse, their advance. |
Mike Carr, CMT, is a member of the Market Technicians Association, and editor of the MTA's newsletter, Technically Speaking. He is also the author of "Smarter Investing in Any Economy: The Definitive Guide to Relative Strength Investing," and "Conquering the Divide: How to Use Economic Indicators to Catch Stock Market Trends."
| Website: | www.moneynews.com/blogs/MichaelCarr/id-73 |
| E-mail address: | marketstrategist@gmail.com |
Click here for more information about our publications!
Comments
Date: 12/18/09Rank: 5Comment:
Date: 12/20/09Rank: 5Comment:

Request Information From Our Sponsors
- StockCharts.com, Inc.
- Candle Patterns
- Candlestick Charting Explained
- Intermarket Technical Analysis
- John Murphy on Chart Analysis
- John Murphy's Chart Pattern Recognition
- John Murphy's Market Message
- MurphyExplainsMarketAnalysis-Intermarket Analysis
- MurphyExplainsMarketAnalysis-Visual Analysis
- StockCharts.com
- Technical Analysis of the Financial Markets
- The Visual Investor
- VectorVest, Inc.
- Executive Premier Workshop
- One-Day Options Course
- OptionsPro
- Retirement Income Workshop
- Sure-Fire Trading Systems (VectorVest, Inc.)
- Trading as a Business Workshop
- VectorVest 7 EOD
- VectorVest 7 RealTime/IntraDay
- VectorVest AutoTester
- VectorVest Educational Services
- VectorVest OnLine
- VectorVest Options Analyzer
- VectorVest ProGraphics v6.0
- VectorVest ProTrader 7
- VectorVest RealTime Derby Tool
- VectorVest Simulator
- VectorVest Variator
- VectorVest Watchdog
