

HOT TOPICS LIST
- MACD
- Fibonacci
- RSI
- Gann
- ADXR
- Stochastics
- Volume
- Triangles
- Futures
- Cycles
- Volatility
- ZIGZAG
- MESA
- Retracement
- Aroon
INDICATORS LIST
LIST OF TOPICS
PRINT THIS ARTICLE
by Austin Passamonte
The recent rally from late September lows has been watched more closely for failure than any I can remember for years. Seems like the momentum players of 2001 have learned to sell every rally in the same manner each dip was bought in 1999 - 2000. But every bull has his day and bears have been befuddled for some time now.
Position: N/A
Austin Passamonte
Austin is a private trader who trades emini stock index futures intraday. He currently trades various futures markets from home in addition to managing a trader's educational forum
PRINT THIS ARTICLE
INDEX OPTION TRADING
Timing The Old-Economy Trend
11/20/01 11:22:31 AMby Austin Passamonte
The recent rally from late September lows has been watched more closely for failure than any I can remember for years. Seems like the momentum players of 2001 have learned to sell every rally in the same manner each dip was bought in 1999 - 2000. But every bull has his day and bears have been befuddled for some time now.
Position: N/A
| Markets are now overbought, markets are still oversold... pick a time frame and indicator for points of reference and a case could be made for each. What we do know for sure is the trend is our friend (how trite but true) and right now it is decidedly up. |
| But does that make price levels right now the next bullish play entry point? |
|
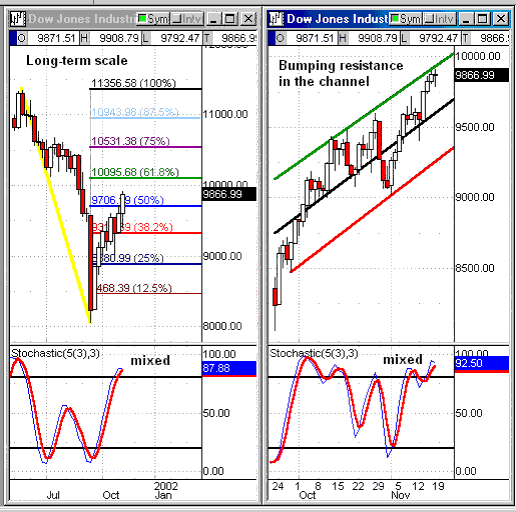
| Figure 1: A closer look at the Dow Jones rally. |
| Graphic provided by: Quote.com. |
| Graphic provided by: QCharts. |
| |
| Our weekly chart of the Dow (left side) shows retracement from May highs down to September lows and back up again. In this case we see where 9,300 level was a centerline for five straight weeks until price action finally broke away. Using consolidation theory that the pause from 8,100 lows to 9,300 in the Dow was half of the eventual move, we then extrapolate the 1,200 Dow points difference to 9,300 and arrive at 10,500 as an eventual target higher. See any points of reference where that matches up on the weekly chart? Yep, 75% retracement of the entire range! |
| The past three days have held near resistance while next support at the mid-value price magnet (black line) is near 9,600 area and rising. All we have to do is leave this bracket in place on our daily charts, and if the Dow retreats to that center line and holds we consider going long. If it breaks and closes below said measures of support, we consider going short in expectation of the next bounce from red line below. A clean break of that measure might just signal the current trend is due for a change! Stochastic values are mixed to weak in overbought extreme right now, but are not in the midst of a bearish reversal quite yet. Also, should the Dow find its way some 650 points higher in the near future without pulling back to support first, I would personally look to short that 10,500 level with DJX options bear-call credit spreads being one clear choice for favorable risk reward. We have our defined boundaries for the broad index, I wonder what some of the component sectors look like? |
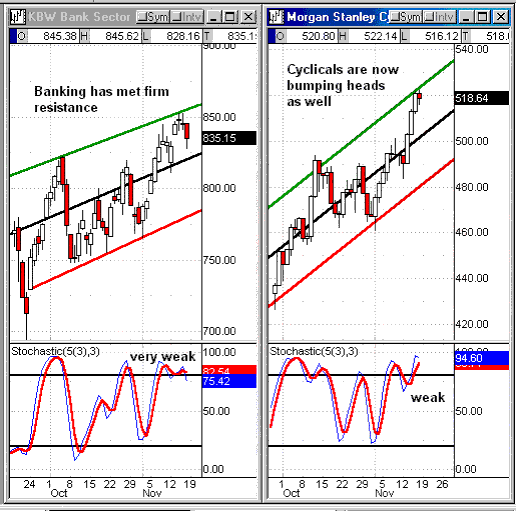 Figure 2: The banking (BKX) and cyclical (CYC) indices are trending up, but nearing resistance. Financials and cyclicals should lead the way during any economic recovery. Lower interest rates and increased capital spending will be seen here first. Indeed we have the Banking (BKX) and Cyclical (CYC) indexes moving up in very defined trends, but now bumping heads at near-term resistance. Notice how financials peaked first and cyclicals lag close behind? This rotation tells us early money is leaking out to other places in the market. With price action up against a ceiling and stochastic values topping out, we might look towards a bounce from support at the black line or especially red line of support for the next high-odds long play entries. Trees don't grow to the sky and price action does not go straight up in a healthy manner. Pullbacks to support are vital to long-term uptrends as layers of backing & filling strengthen price levels below. We should watch for this inevitable process to unfold and should find some profitable entries near support if the new bull is for real. |
Austin is a private trader who trades emini stock index futures intraday. He currently trades various futures markets from home in addition to managing a trader's educational forum
| Title: | Individual Trader |
| Company: | CoiledMarkets.com |
| Address: | PO Box 633 |
| Naples, NY 14512 | |
| Website: | coiledmarkets.com/blog |
| E-mail address: | austinp44@yahoo.com |
Traders' Resource Links | |
| CoiledMarkets.com has not added any product or service information to TRADERS' RESOURCE. | |
Click here for more information about our publications!
Comments
Date:�11/21/01Rank:�5Comment:�
Date:�12/04/01Rank:�5Comment:�

Request Information From Our Sponsors
- StockCharts.com, Inc.
- Candle Patterns
- Candlestick Charting Explained
- Intermarket Technical Analysis
- John Murphy on Chart Analysis
- John Murphy's Chart Pattern Recognition
- John Murphy's Market Message
- MurphyExplainsMarketAnalysis-Intermarket Analysis
- MurphyExplainsMarketAnalysis-Visual Analysis
- StockCharts.com
- Technical Analysis of the Financial Markets
- The Visual Investor
- VectorVest, Inc.
- Executive Premier Workshop
- One-Day Options Course
- OptionsPro
- Retirement Income Workshop
- Sure-Fire Trading Systems (VectorVest, Inc.)
- Trading as a Business Workshop
- VectorVest 7 EOD
- VectorVest 7 RealTime/IntraDay
- VectorVest AutoTester
- VectorVest Educational Services
- VectorVest OnLine
- VectorVest Options Analyzer
- VectorVest ProGraphics v6.0
- VectorVest ProTrader 7
- VectorVest RealTime Derby Tool
- VectorVest Simulator
- VectorVest Variator
- VectorVest Watchdog