HOT TOPICS LIST
- MACD
- Fibonacci
- RSI
- Gann
- ADXR
- Stochastics
- Volume
- Triangles
- Futures
- Cycles
- Volatility
- ZIGZAG
- MESA
- Retracement
- Aroon
INDICATORS LIST
LIST OF TOPICS
PRINT THIS ARTICLE
by Donald W. Pendergast, Jr.
When a proven trading system fires a long signal in the aftermath of a major pattern breakout, wise traders will want to pay special attention to such a setup.
Position: Buy
Donald W. Pendergast, Jr.
Donald W. Pendergast is a financial markets consultant who offers specialized services to stock brokers and high net worth individuals who seek a better bottom line for their portfolios.
PRINT THIS ARTICLE
TRADING SYSTEMS
For EOG Resources, RMO Buy Signal
12/16/09 01:22:10 PMby Donald W. Pendergast, Jr.
When a proven trading system fires a long signal in the aftermath of a major pattern breakout, wise traders will want to pay special attention to such a setup.
Position: Buy
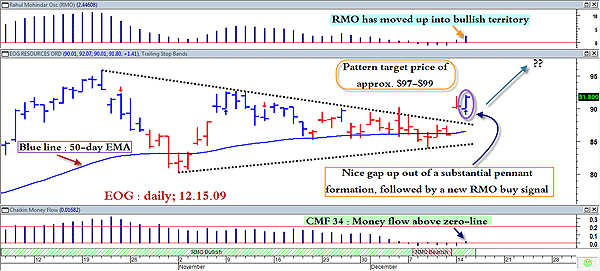
| EOG Resources (EOG), a major player in the energy exploration/production industry group, has just seen its common shares stage a convincing bullish breakout. Even better, a proven trading system has also confirmed that a long entry is the way to go. The daily chart for the stock (Figure 1) also paints a solidly bullish image of strength, and that will be our focus of analysis. |

|
| FIGURE 1: EOG, DAILY. Money flow, price momentum, a successful support test, and a rising 50-day EMA all seem to suggest that EOG may have little trouble rising toward at least $95.86, the major swing high of the pennant formation. |
| Graphic provided by: MetaStock. |
| Graphic provided by: Rahul Mohindar indicators from MetaStock v.11. |
| |
| Like most other solid trade setups, all of the key ingredients are present in sufficient numbers on this daily chart for EOG: * Money flow (which is now above its zero line) is rising steadily, as shown by the Chaikin money flow (CMF)(34). * Momentum is equally bullish, as evidenced by the Rahul Mohindar oscillator (RMO), seen at the very top of the chart. * The RMO trading system (see blue arrow within the lavender oval on the chart) has issued a new buy signal. * The stock has just completed a gap move higher out of a substantial pennant formation and has also completed a tentative support test in the wake of the breakout. * The 50-day exponential moving average (EMA) has acted as steady support for most of the past six weeks and has now begun to slope upward -- another confirmation of the intermediate-term trend in EOG. All in all, this qualifies as a low-risk setup, one worthy of a modest allocation of trading capital. Let's check out a simple way to play EOG shares here. |
| The simplest way is to go long on Wednesday's open with a full trade allocation. Prices might be a bit higher or lower than Tuesday's close ($91.80), but this is still a good way to enter on this large-cap energy stock. Alternatively, more conservative traders might want to enter half a position on a minor intraday pullback, reserving the balance of their trade allocation for a break above Tuesday's high of $92.07. Since this pennant formation suggests that EOG may actually rise as high as $97 to $99 per share, it might be more prudent to run a volatility trailing stop, one set at 2 * ATR(10) away from the daily lows -- those with MetaStock v.11 might instead choose to well utilize a MS11 Intellistop buy (longer-term) trailing stop. If you see EOG approach $97, however, consider closing half your position out, letting the trailing stop take you out of the balance of your position. More impatient traders could also switch to a two-bar trailing stop of the daily lows if the first half of the position eventually is booked as a profit. |
| Will this pennant breakout/RMO buy signal work out? Who knows? All we know is that the stock is presenting us with a technically sound trade setup, one in that risking 1% of a nonmargined trading account should pose little, if any, difficulty for experienced traders to handle. Size your position, take the entry, place your stop and then use whichever trailing stop and/or profit target you feel most comfortable with. Over time, following such a disciplined trading plan should result in a steadily increasing bottom line in your trading account. |
Donald W. Pendergast is a financial markets consultant who offers specialized services to stock brokers and high net worth individuals who seek a better bottom line for their portfolios.
| Title: | Writer, market consultant |
| Company: | Linear Trading Systems LLC |
| Jacksonville, FL 32217 | |
| Phone # for sales: | 904-239-9564 |
| E-mail address: | lineartradingsys@gmail.com |
Traders' Resource Links | |
| Linear Trading Systems LLC has not added any product or service information to TRADERS' RESOURCE. | |
Click here for more information about our publications!
PRINT THIS ARTICLE

Request Information From Our Sponsors
- StockCharts.com, Inc.
- Candle Patterns
- Candlestick Charting Explained
- Intermarket Technical Analysis
- John Murphy on Chart Analysis
- John Murphy's Chart Pattern Recognition
- John Murphy's Market Message
- MurphyExplainsMarketAnalysis-Intermarket Analysis
- MurphyExplainsMarketAnalysis-Visual Analysis
- StockCharts.com
- Technical Analysis of the Financial Markets
- The Visual Investor
- VectorVest, Inc.
- Executive Premier Workshop
- One-Day Options Course
- OptionsPro
- Retirement Income Workshop
- Sure-Fire Trading Systems (VectorVest, Inc.)
- Trading as a Business Workshop
- VectorVest 7 EOD
- VectorVest 7 RealTime/IntraDay
- VectorVest AutoTester
- VectorVest Educational Services
- VectorVest OnLine
- VectorVest Options Analyzer
- VectorVest ProGraphics v6.0
- VectorVest ProTrader 7
- VectorVest RealTime Derby Tool
- VectorVest Simulator
- VectorVest Variator
- VectorVest Watchdog
