HOT TOPICS LIST
- MACD
- Fibonacci
- RSI
- Gann
- ADXR
- Stochastics
- Volume
- Triangles
- Futures
- Cycles
- Volatility
- ZIGZAG
- MESA
- Retracement
- Aroon
INDICATORS LIST
LIST OF TOPICS
PRINT THIS ARTICLE
by Chaitali Mohile
An exclusive advance rally of the NASDAQ Composite has turned sideways due to weakening bullish notes.
Position: N/A
Chaitali Mohile
Active trader in the Indian stock markets since 2003 and a full-time writer. Trading is largely based upon technical analysis.
PRINT THIS ARTICLE
CHART ANALYSIS
NASDAQ Composite In Narrow Range
12/16/09 12:55:36 PMby Chaitali Mohile
An exclusive advance rally of the NASDAQ Composite has turned sideways due to weakening bullish notes.
Position: N/A
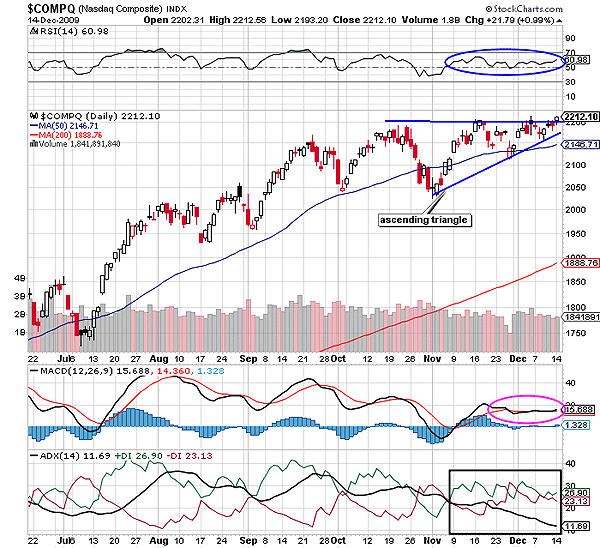
| The NASDAQ Composite ($COMPQ) underwent a robust bullish rally from June 2009. The 50-day moving average (MA) resistance was converted to a much stronger support by a small gap up. After the breakout, the fresh bullish strength pulled the index higher and higher. However, the 50-day MA was challenged frequently when the index bounced from the support with greater pressure, forming higher highs and higher bottoms. Soon, $COMPQ reached the 2200 level on the daily chart in Figure 1. Although the index made higher peaks, the relative strength index (RSI) (14) failed to move above the 70 levels. This suggested that there was restricted bullish strength in the rally. The moving average convergence/divergence (MACD) (12,26,9) descended in positive territory, and thus, the negative divergence decelerated the speed of an upward price action. Both indicators together forced the index to turn sideways for the next couple of days. |

|
| FIGURE 1: $COMPQ, DAILY. The weak ADX(14) resulted in a sideways consolidation, forming an ascending triangle. |
| Graphic provided by: StockCharts.com. |
| |
| In Figure 1, $COMPQ formed an ascending triangle during consolidation. The ascending triangle is a bullish continuation in an uptrend, and sometimes it is also identified as a bullish pennant if it appears after an extensive upward move. The buyer's line (lower trendline) and seller's line (upper trendline) of the triangle in Figure 1 have moved closer and are likely to intercept at one point. Therefore, the ascending triangle has almost matured to break upward and initiate a fresh bullish rally. But the declining average directional index (ADX) (14) below 15 has generated negative sentiments as the developed uptrend has gradually weakened. In addition, the positive directional index (+DI) and the negative directional index (-DI) moving with equal pace are suggesting consolidation. The MACD (12,26,9) has stuck with the trigger line in positive territory. |
| Therefore, there is no significant bullish strength in the rally that can initiate the fresh breakout. According to Figure 1, $COMPQ is likely to move in a narrow volatile range till a new uptrend gets developed and bullish force is generated. |

|
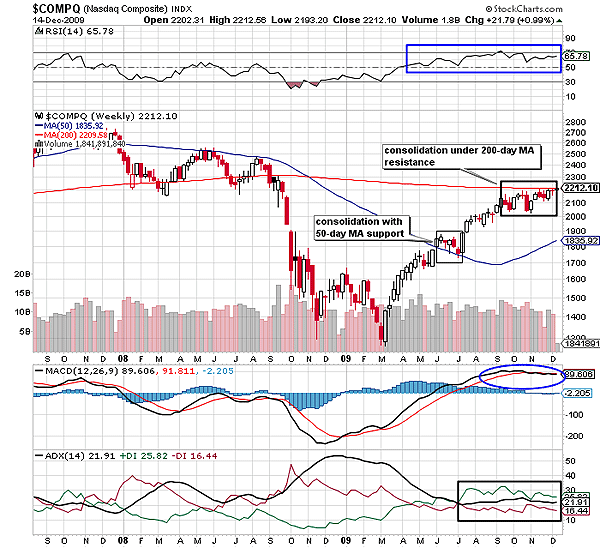
| FIGURE 2: $COMPQ, WEEKLY. The uptrend is developing, but an equal buying and selling pressure would hold back the bullish breakout. |
| Graphic provided by: StockCharts.com. |
| |
| The weekly chart in Figure 2 reveals one more reason for the sideways consolidation. The rally that began with a bullish engulfing candlestick pattern in March 2009 gradually hit its first resistance of 50-day MA. The index consolidated with the newly formed support of MA after a huge bullish rally of 635 points (1835-1200). This consolidation helped $COMPQ gain further strength for the future rally. The RSI (14) surging in bullish area above 50 levels, the positive MACD (12,26,9) shifting in positive territory, and the declining overheated downtrend reconfirmed that another upward rally toward 200-day MA resistance is underway. The breakout was the best low-risk entry for the long-term buyers with the target of 200-day MA. |
| Figure 2 shows that the breakout journey of the index failed to fulfill traders' expectations. The small candles with shadows, and dojis reflect weakness in the rally. In addition, the bearish candles appeared as $COMPQ ran nearer the MA resistance. Although the downtrend was reversed, the ADX (14) could not sustain in the developed uptrend zone. We can see the ADX (14) is currently at 21 levels with equal buying and selling pressure. Therefore, though the uptrend is developing, the index is likely to turn volatile under the 200-day MA resistance. Due to the resistance in Figure 2, the bullish rally on the daily time frame was suppressed and as a result the ascending triangle was formed (see Figure 1). Thus, $COMPQ should continue consolidating in a narrow range for the next few weeks. |
Active trader in the Indian stock markets since 2003 and a full-time writer. Trading is largely based upon technical analysis.
| Company: | Independent |
| Address: | C1/3 Parth Indraprasth Towers. Vastrapur |
| Ahmedabad, Guj 380015 | |
| E-mail address: | chaitalimohile@yahoo.co.in |
Traders' Resource Links | |
| Independent has not added any product or service information to TRADERS' RESOURCE. | |
Click here for more information about our publications!
Comments
Date: 12/17/09Rank: 4Comment:

Request Information From Our Sponsors
- VectorVest, Inc.
- Executive Premier Workshop
- One-Day Options Course
- OptionsPro
- Retirement Income Workshop
- Sure-Fire Trading Systems (VectorVest, Inc.)
- Trading as a Business Workshop
- VectorVest 7 EOD
- VectorVest 7 RealTime/IntraDay
- VectorVest AutoTester
- VectorVest Educational Services
- VectorVest OnLine
- VectorVest Options Analyzer
- VectorVest ProGraphics v6.0
- VectorVest ProTrader 7
- VectorVest RealTime Derby Tool
- VectorVest Simulator
- VectorVest Variator
- VectorVest Watchdog
- StockCharts.com, Inc.
- Candle Patterns
- Candlestick Charting Explained
- Intermarket Technical Analysis
- John Murphy on Chart Analysis
- John Murphy's Chart Pattern Recognition
- John Murphy's Market Message
- MurphyExplainsMarketAnalysis-Intermarket Analysis
- MurphyExplainsMarketAnalysis-Visual Analysis
- StockCharts.com
- Technical Analysis of the Financial Markets
- The Visual Investor
