HOT TOPICS LIST
- MACD
- Fibonacci
- RSI
- Gann
- ADXR
- Stochastics
- Volume
- Triangles
- Futures
- Cycles
- Volatility
- ZIGZAG
- MESA
- Retracement
- Aroon
INDICATORS LIST
LIST OF TOPICS
PRINT THIS ARTICLE
by Donald W. Pendergast, Jr.
The long-anticipated turn in the US dollar appears to be underway. But is this a tradable move?
Position: Accumulate
Donald W. Pendergast, Jr.
Donald W. Pendergast is a financial markets consultant who offers specialized services to stock brokers and high net worth individuals who seek a better bottom line for their portfolios.
PRINT THIS ARTICLE
MACD
Long Dollar, Short Gold
12/14/09 08:33:07 AMby Donald W. Pendergast, Jr.
The long-anticipated turn in the US dollar appears to be underway. But is this a tradable move?
Position: Accumulate
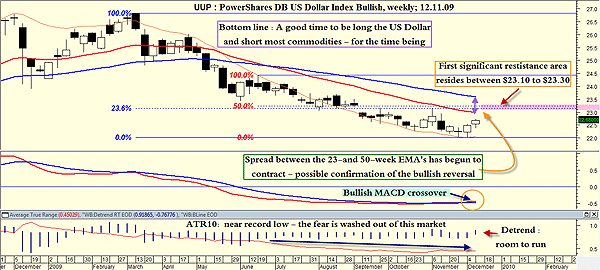
| Negative sentiment can be an extremely valuable trading tool for those serious about earning consistent profits in the financial markets. And nowhere has the sentiment been so persistently negative as in the US dollar. Clearly, some sort of weekly low has formed or is in the process of completion in this key currency market, but just how far might the dollar rise before meeting up with strong resistance? We'll begin with a look at the weekly chart of UUP, one of the exchange traded funds that seeks to replicate the performance of a variety US dollar futures contracts. |

|
| FIGURE 1: UUP, WEEKLY. Although no chart setup is a sure thing, the bias has clearly shifted toward the bear market rally phase in the US dollar. |
| Graphic provided by: MetaStock. |
| Graphic provided by: WB Detrend RT EOD from ProfitTrader for MetaStock. |
| |
| Yes, Figure 1 is a very simple chart, but we don't need any fancy neural networks or algorithms to conclude that the beleaguered greenback has begun a turn higher. The moving average convergence/divergence (MACD) indicator (middle panel on chart) has already completed a bullish crossover, confirming the shift in momentum toward the bullish side of the ledger. In addition, the spread between two key moving averages (the 21-week exponential moving average [EMA] and the 50-week EMA [red line and blue line on the chart, respectively]) has begun to decline as prices have begun a gradual ascent from their bear market lows. At the very bottom of the chart, witness how the average true range (ATR 10; the thin red line in the bottom panel) has declined to near-record levels, indicating that much of the fear formerly embedded into this market has all but dissipated. The detrend oscillator (blue histogram) also suggests that UUP has plenty of room to run higher, should the US dollar really begin to catch a bid here. Of course, after such a massive, multiyear decline, traders must realize that there is a ton of overhead supply that will offer plenty of resistance on any further advances. The most likely price area in which to expect to see UUP temporarily stall and/or reverse is near the combined Fibonacci retracement confluence level near $23.10 to $23.30 (see the pink rectangle on the chart). |
| Commercial interests in the futures market (based on COT data analysis) appear to have already completed the bulk of their buying even as the large speculators appear to be ramping up their long acquisitions as their various trend-following systems begin to fire long signals on the current upthrust. And even if UUP (and all dollar-related futures contracts and forex spreads) stumble if that resistance area turns back price, if this is a major bear market rally (like the one we witnessed in 2005) in the greenback, we might be amazed at how far this rally can retrace some of the more recent losses that this market has experienced. |
| One simple way to play this potentially bullish move is to sell deep out-of-the-money (OTM) put options on a deferred-month US dollar futures contract. Alternatively, selling far OTM, deferred-month call options in the euro, aussie and Canadian currencies might also prove to be a relatively low-risk play. Check with your broker for the margin requirements involved, and above all else have an exit strategy in place just in case the US dollar suddenly changes its mind and decides to hammer out a lower low in the near term. |
Donald W. Pendergast is a financial markets consultant who offers specialized services to stock brokers and high net worth individuals who seek a better bottom line for their portfolios.
| Title: | Writer, market consultant |
| Company: | Linear Trading Systems LLC |
| Jacksonville, FL 32217 | |
| Phone # for sales: | 904-239-9564 |
| E-mail address: | lineartradingsys@gmail.com |
Traders' Resource Links | |
| Linear Trading Systems LLC has not added any product or service information to TRADERS' RESOURCE. | |
Click here for more information about our publications!
Comments
Date: 12/15/09Rank: 5Comment:
Date: 12/15/09Rank: 5Comment:

Request Information From Our Sponsors
- StockCharts.com, Inc.
- Candle Patterns
- Candlestick Charting Explained
- Intermarket Technical Analysis
- John Murphy on Chart Analysis
- John Murphy's Chart Pattern Recognition
- John Murphy's Market Message
- MurphyExplainsMarketAnalysis-Intermarket Analysis
- MurphyExplainsMarketAnalysis-Visual Analysis
- StockCharts.com
- Technical Analysis of the Financial Markets
- The Visual Investor
- VectorVest, Inc.
- Executive Premier Workshop
- One-Day Options Course
- OptionsPro
- Retirement Income Workshop
- Sure-Fire Trading Systems (VectorVest, Inc.)
- Trading as a Business Workshop
- VectorVest 7 EOD
- VectorVest 7 RealTime/IntraDay
- VectorVest AutoTester
- VectorVest Educational Services
- VectorVest OnLine
- VectorVest Options Analyzer
- VectorVest ProGraphics v6.0
- VectorVest ProTrader 7
- VectorVest RealTime Derby Tool
- VectorVest Simulator
- VectorVest Variator
- VectorVest Watchdog
