HOT TOPICS LIST
- MACD
- Fibonacci
- RSI
- Gann
- ADXR
- Stochastics
- Volume
- Triangles
- Futures
- Cycles
- Volatility
- ZIGZAG
- MESA
- Retracement
- Aroon
INDICATORS LIST
LIST OF TOPICS
PRINT THIS ARTICLE
by Austin Passamonte
Here's the near-term to mid-term technical outlook for the Standard & Poor's 500.
Position: N/A
Austin Passamonte
Austin is a private trader who trades emini stock index futures intraday. He currently trades various futures markets from home in addition to managing a trader's educational forum
PRINT THIS ARTICLE
TECHNICAL ANALYSIS
Losing Steam
12/08/09 09:14:25 AMby Austin Passamonte
Here's the near-term to mid-term technical outlook for the Standard & Poor's 500.
Position: N/A
| The year 2009 will long be remembered as one of an incredible rally. Stock markets bottomed in early March and proceeded to stage an ascent for the ages. It is fairly safe to say that no one expected stock index markets to rise so far in so little time, relative to the collapse from peak to trough since 2008. |

|
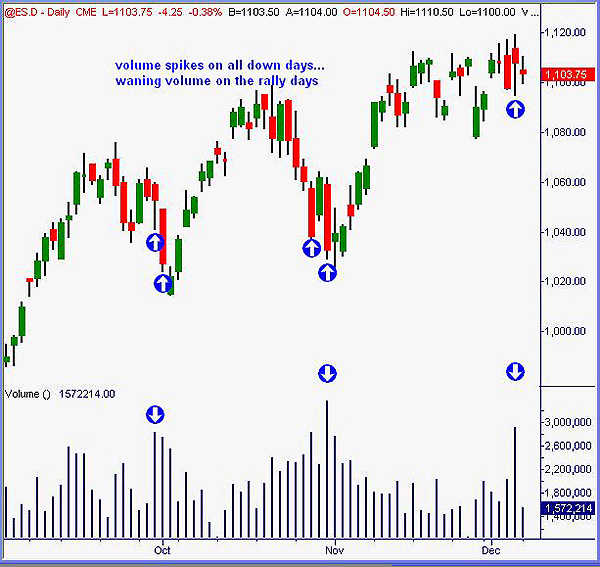
| FIGURE 1: S&P 500, DAILY |
| Graphic provided by: TradeStation. |
| |
| But up they went, with nary a correction of any substance at all (Figure 1). Recent index highs from the ES 1,000 to 1,100 levels have seen a couple of bumps in the road, each pullback resulting in significant volume spikes. Ensuing rally sessions to new subsequent highs followed suit on withering volume, and usually through overnight gap-up levitations. That is not a formula for solid base-building below: more indicative of price action gasping for breadth (pun intended) at price extension extremes. |

|
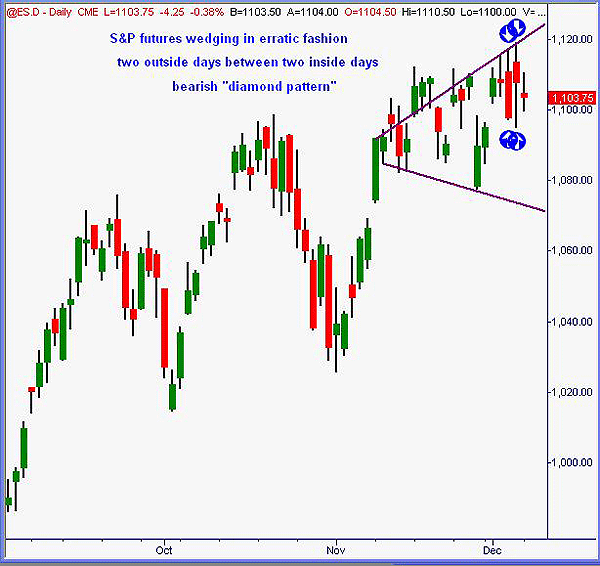
| FIGURE 2: S&P 500, DAILY |
| Graphic provided by: TradeStation. |
| |
| The month of December began with a gap-up rally session, followed by four successive red sessions to date (Figure 2). Two outside sessions (blue arrows) on Thursday, December 3, and Friday, December 4, were likewise followed by an inside session (December 7) that outlines a bearish "diamond" pattern formation. In other words, price is wedging itself in unstable fashion -- not storing energy for a continuation upside. |
| Broadening the view shows price action widening in a broader bearish or "megaphone" wedge. Note all the gaps and holes in this chart from early November onward. Looks just like a block of Swiss cheese -- with air pockets galore. Rather than methodical ascent with stable price support below, there is little more than random spurt and sputter price action through these past several weeks. Again, not the stuff that lasting base-building resembles. |
| The US dollar correlation to stock index markets is at a high percentage peak right now. Rather than deliberate, methodical accumulation of stocks by strong-hand buyers pushing the rally up to new highs, we see knee-jerk reactions to the USD price action instead. Again, not how sustained price continuation is usually supported. As 2009 plays out the end, 2010 may begin with stock index markets riding on waning steam. |
Austin is a private trader who trades emini stock index futures intraday. He currently trades various futures markets from home in addition to managing a trader's educational forum
| Title: | Individual Trader |
| Company: | CoiledMarkets.com |
| Address: | PO Box 633 |
| Naples, NY 14512 | |
| Website: | coiledmarkets.com/blog |
| E-mail address: | austinp44@yahoo.com |
Traders' Resource Links | |
| CoiledMarkets.com has not added any product or service information to TRADERS' RESOURCE. | |
Click here for more information about our publications!
Comments
Date: 12/08/09Rank: 4Comment:
Date: 12/08/09Rank: 4Comment:
Date: 12/10/09Rank: 3Comment:

Request Information From Our Sponsors
- StockCharts.com, Inc.
- Candle Patterns
- Candlestick Charting Explained
- Intermarket Technical Analysis
- John Murphy on Chart Analysis
- John Murphy's Chart Pattern Recognition
- John Murphy's Market Message
- MurphyExplainsMarketAnalysis-Intermarket Analysis
- MurphyExplainsMarketAnalysis-Visual Analysis
- StockCharts.com
- Technical Analysis of the Financial Markets
- The Visual Investor
- VectorVest, Inc.
- Executive Premier Workshop
- One-Day Options Course
- OptionsPro
- Retirement Income Workshop
- Sure-Fire Trading Systems (VectorVest, Inc.)
- Trading as a Business Workshop
- VectorVest 7 EOD
- VectorVest 7 RealTime/IntraDay
- VectorVest AutoTester
- VectorVest Educational Services
- VectorVest OnLine
- VectorVest Options Analyzer
- VectorVest ProGraphics v6.0
- VectorVest ProTrader 7
- VectorVest RealTime Derby Tool
- VectorVest Simulator
- VectorVest Variator
- VectorVest Watchdog
