HOT TOPICS LIST
- MACD
- Fibonacci
- RSI
- Gann
- ADXR
- Stochastics
- Volume
- Triangles
- Futures
- Cycles
- Volatility
- ZIGZAG
- MESA
- Retracement
- Aroon
INDICATORS LIST
LIST OF TOPICS
PRINT THIS ARTICLE
by Chaitali Mohile
Merck Inc. is likely to surge into a long-term bullish zone.
Position: Buy
Chaitali Mohile
Active trader in the Indian stock markets since 2003 and a full-time writer. Trading is largely based upon technical analysis.
PRINT THIS ARTICLE
BREAKOUTS
Fresh Breakout Of Merck
12/04/09 01:03:25 PMby Chaitali Mohile
Merck Inc. is likely to surge into a long-term bullish zone.
Position: Buy
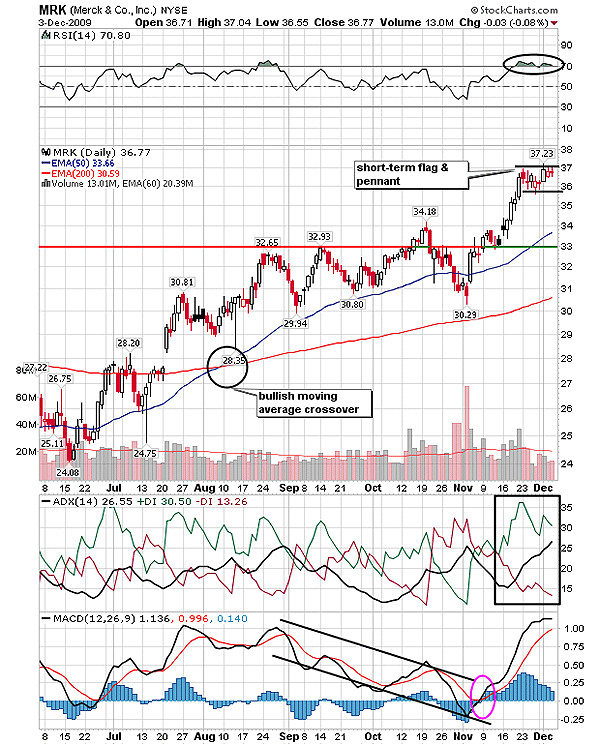
| After a bullish moving average crossover, the rally of Merck Inc. (MRK) gained bullish strength. A bullish moving average crossover means that the shorter-term moving average crosses above the long-term moving average. In Figure 1, the 50-day exponential moving average (EMA) moved upward and crossed above the 200-day MA (see marked circle). The 50-day exponential MA as well as the 200-day MA support was retested during the upward movement. However, the rally witnessed high volatility due to a weak trend indicated by the average directional index (ADX)(14). Frequent battles between buyers and sellers can be seen in the average directional movement index (ADX)(14), which changed direction throughout the bullish journey. The moving average convergence/divergence (MACD) (12,26,9) descended, creating a negative divergence for the price action above the 50-day MA. Therefore, MRK was unable to break the resistance at $32 initially. |

|
| FIGURE 1: MRK, DAILY. The stock awaits the bullish breakout of the flag & pennant pattern due to the reluctant RSI(14). |
| Graphic provided by: StockCharts.com. |
| |
| An attempt was made to breach the resistance. But it failed since the bearish strength pulled down MRK from the fresh high at $34 in October. The stock plunged to challenge the 200-day EMA. A bullish crossover of MACD (12,26,9) in negative territory and a developing uptrend in Figure 1 added significant bullish force to convert the resistance at $32 into support. The rise in volume helped sustain the newly formed support. The red portion of the support-resistance tool shows resistance at $32-$34, and the green highlights the support for MRK. The relative strength index (RSI) (14) surged into a bullish area above the 50 levels, indicating a fresh trading point for buyers. Thus, many traders would have triggered long positions above $34. Since $34 was an immediate high for the breakout at $32, the best low-risk entry was possible only above $34. Later, the stock consolidated in a narrow range between $36 and $37 as seen in Figure 1. The consolidation formed a very short-term bullish flag & pennant formation. |
| The MACD and ADX are bullish, which would maintain the bullish sentiments toward the rally. Although the RSI (14) is bullish, it seems reluctant to climb higher than the 70 levels. As a result, the bullish breakout of the flag & pennant pattern might get delayed, but would not harm the breakout. Therefore, traders can set a new long trade after the confirmed breakout at $37 with the target of 37 - 34 = 3 + 37 = $40. |

|
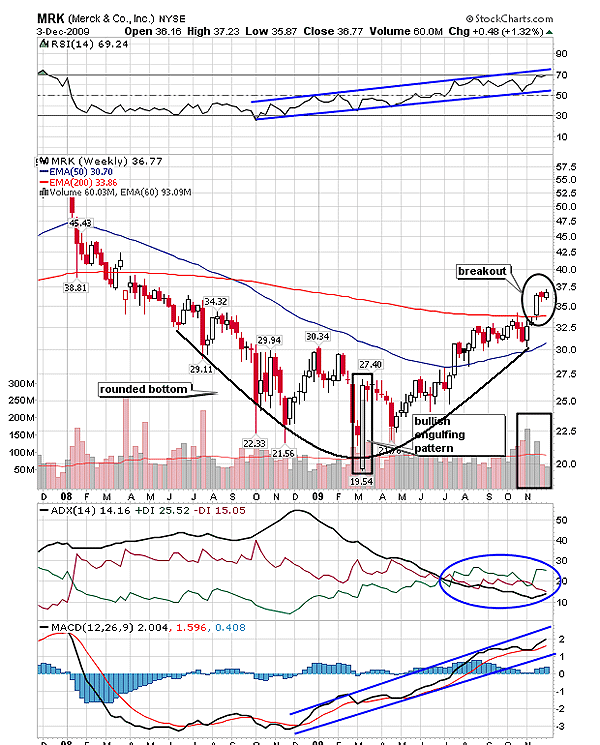
| FIGURE 2: MRK, WEEKLY. After the bullish breakout of the rounded bottom, MRK has established robust support at the 200-day exponential moving average. |
| Graphic provided by: StockCharts.com. |
| |
| The pattern in Figure 1 is for short-term traders, but those looking for a long-term investment, there is an interesting trading opportunity on the weekly time frame in Figure 2. Here, MRK has bottomed out by forming a rounded bottom. This pattern is a bullish reversal pattern and the breakout occurs as the price breaches the MA resistance. In Figure 2, the stock formed higher lows after a huge bullish engulfing candlestick pattern was developed. Gradually, MRK moved toward the 200-day EMA and marginally turned sideways before actually breaking upward. After many volatile sessions, MRK successfully converted the 200-day MA resistance to support. This breakout is the best long-term buying opportunity. |
| The RSI (14) has moved vertically upward, suggesting the developing bullish strength in the rally. The MACD (12,26,9) is also positive. But the ADX (14) is weak with equal buying and selling pressure, and as a result, the stock is likely to consolidate till the strong uptrend is developed. Since MRK has established strong support on the 200-day MA on the weekly time frame, the breakout is likely to sustain. The minimum estimated level on the rounded-bottom breakout is measured as 33 - 19.54 = 13.46 + 33(breakout level) = $46.46. Thus, in the long run MRK is likely to be an attractive stock. |
Active trader in the Indian stock markets since 2003 and a full-time writer. Trading is largely based upon technical analysis.
| Company: | Independent |
| Address: | C1/3 Parth Indraprasth Towers. Vastrapur |
| Ahmedabad, Guj 380015 | |
| E-mail address: | chaitalimohile@yahoo.co.in |
Traders' Resource Links | |
| Independent has not added any product or service information to TRADERS' RESOURCE. | |
Click here for more information about our publications!
Comments
Date: 12/05/09Rank: 5Comment:

Request Information From Our Sponsors
- StockCharts.com, Inc.
- Candle Patterns
- Candlestick Charting Explained
- Intermarket Technical Analysis
- John Murphy on Chart Analysis
- John Murphy's Chart Pattern Recognition
- John Murphy's Market Message
- MurphyExplainsMarketAnalysis-Intermarket Analysis
- MurphyExplainsMarketAnalysis-Visual Analysis
- StockCharts.com
- Technical Analysis of the Financial Markets
- The Visual Investor
- VectorVest, Inc.
- Executive Premier Workshop
- One-Day Options Course
- OptionsPro
- Retirement Income Workshop
- Sure-Fire Trading Systems (VectorVest, Inc.)
- Trading as a Business Workshop
- VectorVest 7 EOD
- VectorVest 7 RealTime/IntraDay
- VectorVest AutoTester
- VectorVest Educational Services
- VectorVest OnLine
- VectorVest Options Analyzer
- VectorVest ProGraphics v6.0
- VectorVest ProTrader 7
- VectorVest RealTime Derby Tool
- VectorVest Simulator
- VectorVest Variator
- VectorVest Watchdog
