HOT TOPICS LIST
- MACD
- Fibonacci
- RSI
- Gann
- ADXR
- Stochastics
- Volume
- Triangles
- Futures
- Cycles
- Volatility
- ZIGZAG
- MESA
- Retracement
- Aroon
INDICATORS LIST
LIST OF TOPICS
PRINT THIS ARTICLE
by Chaitali Mohile
Similar to other stocks and indexes, Alcon Inc. also felt the heat of the huge bearish wave of last year. The steady recovery from the lowest levels is likely to continue with the recent breakout.
Position: Buy
Chaitali Mohile
Active trader in the Indian stock markets since 2003 and a full-time writer. Trading is largely based upon technical analysis.
PRINT THIS ARTICLE
FLAGS AND PENNANTS
Alcon Forms Multiple Bullish Formations
12/03/09 12:29:08 PMby Chaitali Mohile
Similar to other stocks and indexes, Alcon Inc. also felt the heat of the huge bearish wave of last year. The steady recovery from the lowest levels is likely to continue with the recent breakout.
Position: Buy
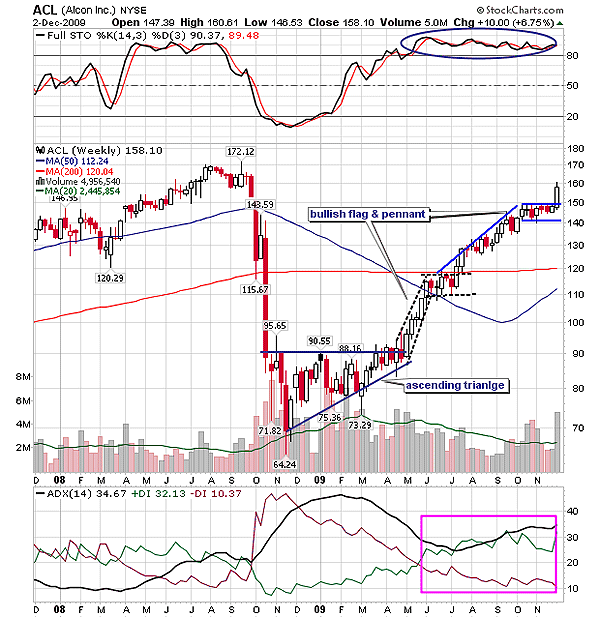
| Alcon Inc. (ACL) consolidated at the new low in 2008-09 with a flat upper range and an ascending lower range. The narrowing range and volatile volume formed an ascending triangle in an overheated downtrend in Figure 1. An ascending triangle at the bottom of the corrective rally signals a major trend reversal situation, and if the pattern appears in an uptrend, we consider it as a bullish continuation pattern. Hence, the pattern in Figure 1 is a trend reversal. The average directional movement index (ADX) (14) had moved above 40 levels, indicating a highly overheated downtrend that is ready to reverse. The declining ADX (14) generated bullish sentiments, forming higher lows. In addition, an oversold stochastic (14,3,3) shifted upward. The highly bearish indicators confirmed the ascending triangle as a trend reversal formation. |
| The bullish breakout of the triangular pattern offered the best buying opportunities for the traders after a reasonably long time. The ADX (14) gradually moved above 25 levels with higher buying pressure, indicating a developing uptrend. After the target on the ascending triangle (90 - 64 = 26 + 90 = 116) was hit, ACL consolidated in the range of 120-110. During consolidation, the long-term moving average (MA) that is the 200-day MA formed a stronger upper range resistance. The consolidation formed a bullish flag & pennant -- a bullish continuation pattern. This formation poured additional bullish strength, developing a strong momentum for ACL. The pattern breakout breached the 200-day MA resistance as well. Thus, another robust breakout appeared on the weekly time frame in Figure 1. The potential target on the bullish flag & pennant is measured by adding the size of an advance rally (flag pole) to the breakout level. Therefore, 120 - 90 = 30 + 120 = 150 is the minimum estimated level for ACL. |

|
| FIGURE 1: ACL, WEEKLY. The bullish flag & pennant broke upward. The fresh target of 180 levels would be achieved on the bullish notes reflected by the chart here. |
| Graphic provided by: StockCharts.com. |
| |
| We can see that the stock turned sideways exactly at 150 levels after an exclusive bullish breakout rally. Thus, the second bullish flag & pennant was formed on the weekly chart in Figure 1. The ADX (14) is suggesting a well-developed uptrend, and the stochastic oscillator has been overbought for the past few weeks. Currently, the chart is healthily bullish so the breakout is likely to carry ACL higher toward the target of 150 - 120 = 30 + 150 = 180. The calculation of minimum estimated level remains the same as above. But the stock has already rallied 10 points during the breakout session on December 2. Obviously, many trades might have missed the train. Often, the stock consolidates after the huge single-day rally. A similar move is anticipated for ACL and, thus, would set up a fresh buy level. |
| Hence, ACL should remain in a robust bullish mood for the near future and drag the price higher. |
Active trader in the Indian stock markets since 2003 and a full-time writer. Trading is largely based upon technical analysis.
| Company: | Independent |
| Address: | C1/3 Parth Indraprasth Towers. Vastrapur |
| Ahmedabad, Guj 380015 | |
| E-mail address: | chaitalimohile@yahoo.co.in |
Traders' Resource Links | |
| Independent has not added any product or service information to TRADERS' RESOURCE. | |
Click here for more information about our publications!
PRINT THIS ARTICLE

Request Information From Our Sponsors
- StockCharts.com, Inc.
- Candle Patterns
- Candlestick Charting Explained
- Intermarket Technical Analysis
- John Murphy on Chart Analysis
- John Murphy's Chart Pattern Recognition
- John Murphy's Market Message
- MurphyExplainsMarketAnalysis-Intermarket Analysis
- MurphyExplainsMarketAnalysis-Visual Analysis
- StockCharts.com
- Technical Analysis of the Financial Markets
- The Visual Investor
- VectorVest, Inc.
- Executive Premier Workshop
- One-Day Options Course
- OptionsPro
- Retirement Income Workshop
- Sure-Fire Trading Systems (VectorVest, Inc.)
- Trading as a Business Workshop
- VectorVest 7 EOD
- VectorVest 7 RealTime/IntraDay
- VectorVest AutoTester
- VectorVest Educational Services
- VectorVest OnLine
- VectorVest Options Analyzer
- VectorVest ProGraphics v6.0
- VectorVest ProTrader 7
- VectorVest RealTime Derby Tool
- VectorVest Simulator
- VectorVest Variator
- VectorVest Watchdog
