HOT TOPICS LIST
- MACD
- Fibonacci
- RSI
- Gann
- ADXR
- Stochastics
- Volume
- Triangles
- Futures
- Cycles
- Volatility
- ZIGZAG
- MESA
- Retracement
- Aroon
INDICATORS LIST
LIST OF TOPICS
PRINT THIS ARTICLE
by Koos van der Merwe
The ETF is suggesting a head & shoulder formation developing. Is this a forecast of a major correction?
Position: Sell
Koos van der Merwe
Has been a technical analyst since 1969, and has worked as a futures and options trader with First Financial Futures in Johannesburg, South Africa.
PRINT THIS ARTICLE
HEAD & SHOULDERS
Powershares Dynamic Small Cap Value Calling For Major Correction?
12/02/09 08:51:29 AMby Koos van der Merwe
The ETF is suggesting a head & shoulder formation developing. Is this a forecast of a major correction?
Position: Sell
| PowerShares Dynamic Small Cap Value Portfolio (referred to here as the fund) seeks investment results that correspond to the price and yield of an equity index called the Dynamic Small Cap Value Intellidex Index (also known as the Intellidex). The Intellidex consists of 100 US small-cap value stocks selected for the most part on the basis of their capital appreciation potential as identified by the AMEX (the Intellidex Provider) pursuant to an Intellidex methodology. The fund will normally invest at least 80% of its total assets in common stocks of small-capitalization companies. The fund will normally invest at least 90% of its total assets in common stocks that make up the Intellidex. The Intellidex is adjusted quarterly, and the fund, using an indexing investment approach, attempts to replicate the performance of the Intellidex. |

|
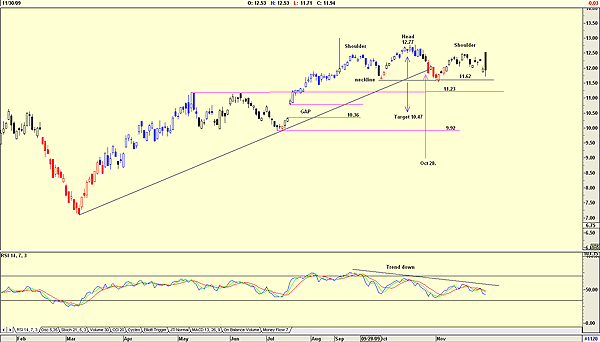
| FIGURE 1: POWERSHARES, DAILY |
| Graphic provided by: AdvancedGET. |
| |
| Figure 1 shows a very definite head & shoulders formation developing with a target of 10.47 (12.77 - 11.62 = 1.15. 11.62 - 1.15 = 10.47). The chart also suggests the following: -A falling relative strength index (RSI) -A gap with a lower end of 10.36. Prices tend to fill the gap, which means that the gap is suggesting that the head & shoulders formation will materialize. -Two pivot point resistance levels, one at 11.23 and the other at 9.92. -Finally, note that the exchange traded fund (ETF) broke its upward support line on October 28. So is this a sign of a future correction? Quite possible, but we may see a sideways movement for some time before a testing and possible break of the neckline. Do not forget that small caps usually lead the way with mid-caps following weeks later and large caps always the laggards. Traders could take a short position once the price breaks the neckline at 11.62. |
Has been a technical analyst since 1969, and has worked as a futures and options trader with First Financial Futures in Johannesburg, South Africa.
| Address: | 3256 West 24th Ave |
| Vancouver, BC | |
| Phone # for sales: | 6042634214 |
| E-mail address: | petroosp@gmail.com |
Click here for more information about our publications!
PRINT THIS ARTICLE

Request Information From Our Sponsors
- StockCharts.com, Inc.
- Candle Patterns
- Candlestick Charting Explained
- Intermarket Technical Analysis
- John Murphy on Chart Analysis
- John Murphy's Chart Pattern Recognition
- John Murphy's Market Message
- MurphyExplainsMarketAnalysis-Intermarket Analysis
- MurphyExplainsMarketAnalysis-Visual Analysis
- StockCharts.com
- Technical Analysis of the Financial Markets
- The Visual Investor
- VectorVest, Inc.
- Executive Premier Workshop
- One-Day Options Course
- OptionsPro
- Retirement Income Workshop
- Sure-Fire Trading Systems (VectorVest, Inc.)
- Trading as a Business Workshop
- VectorVest 7 EOD
- VectorVest 7 RealTime/IntraDay
- VectorVest AutoTester
- VectorVest Educational Services
- VectorVest OnLine
- VectorVest Options Analyzer
- VectorVest ProGraphics v6.0
- VectorVest ProTrader 7
- VectorVest RealTime Derby Tool
- VectorVest Simulator
- VectorVest Variator
- VectorVest Watchdog
