

HOT TOPICS LIST
- MACD
- Fibonacci
- RSI
- Gann
- ADXR
- Stochastics
- Volume
- Triangles
- Futures
- Cycles
- Volatility
- ZIGZAG
- MESA
- Retracement
- Aroon
INDICATORS LIST
LIST OF TOPICS
PRINT THIS ARTICLE
by Ron Walker
As the spotlight focuses on the Dow Jones industrials making new highs above 10,000, the transports have underperformed as they continue to sidestep, remaining range bound. The transports are colliding with overhead resistance on the daily chart, while simultaneously crashing into its declining primary trendline on the weekly chart. Can the transports overcome resistance in multiple time frames?
Position: N/A
Ron Walker
Ron Walker is an active trader and technical analyst. He operates an educational website dedicated to the study of Technical Analysis. The website offers free market analysis with daily video presentations and written commentaries. Ron is a video pioneer, being one of the first to utilize the internet producing Technical Analysis videos. His website is thechartpatterntrader.com
PRINT THIS ARTICLE
RESISTANCE LINE
With The Transports, Resistance In Multiple Time Frames
12/02/09 10:27:35 AMby Ron Walker
As the spotlight focuses on the Dow Jones industrials making new highs above 10,000, the transports have underperformed as they continue to sidestep, remaining range bound. The transports are colliding with overhead resistance on the daily chart, while simultaneously crashing into its declining primary trendline on the weekly chart. Can the transports overcome resistance in multiple time frames?
Position: N/A
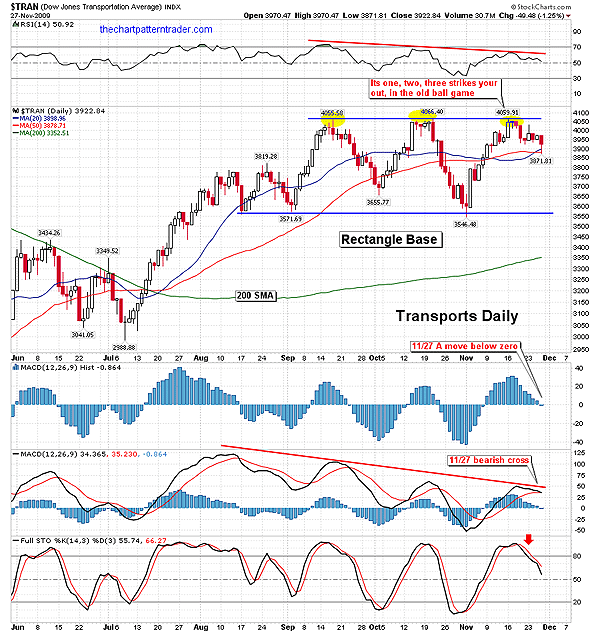
| Currently, we see the Dow Jones Transportation Average ($TRAN) is range bound as prices are contained between two boundaries; a line of support (demand) at the bottom and a line of resistance at the top (supply) (Figure 1). These two horizontal trendlines resemble a rectangle, which is a common chart pattern in technical analysis. The pattern often appears as prices build a base. However, the pattern can be both a continuation and a reversal pattern. |
|
| FIGURE 1: $TRAN, DAILY. Over the last three months, three individual peaks (highlighted in yellow) have stalled prices just above the 4000 area. The bearish momentum on the histogram and stochastic should allow the bearish divergences on the RSI and MACD to carry prices back to support. |
| Graphic provided by: StockCharts.com. |
| |
| After the last rally in November, a reaction occurred off resistance, which is the horizontal upper boundary of the rectangle pattern, called the return line. The recent high made in November failed to hold onto gains, getting a reaction at that resistance zone. Over the past three months, the transports have had trouble clearing the mid-4000 area, having made three separate attempts to do so, but each attempt was met with a reversal. Often in technical analysis, it is only after the failure of third or fourth rally that prices finally give up and make a change in trend, taking the path of least resistance. In baseball, it's one, two, three strikes you're out in the old ballgame, and that's often the case for prices. |
| In Figure 1, we see some bearish signs on the $TRAN daily chart. A bearish divergence has formed on the relative strength index (RSI)(14), putting in three successive lower peaks at each rally, while prices have made almost equivalent peaks during those periods. This is known as a class B divergence. It is where prices make matching highs, while the indicator makes lower highs. Then on November 27, the moving average convergence/divergence (MACD) histogram (12,26,9) moved below the zero line, causing the MACD to cross below its signal line. In addition, the stochastic (14,3,3) got a bearish crossover in mid-November. The stochastic line has gotten a steep drop heading for the median line at 50. These bearish signals on the indicators will likely take a toll on $TRAN and cause it to decline back to the support line. |
| Should prices penetrate support, we can measure the downside risk by subtracting the lowest point of the pattern from the highest point (4066 - 3546 = 520 points), which gives the minimum objective target of the pattern, which is 520 points. That means if the rectangle has a bearish resolution, it measures to a minimum target of 3026. That would cause $TRAN to test the lows made last summer. That would take $TRAN below its 200-day simple moving average. However, if $TRAN can somehow overcome these bearish obstacles and clear the horizontal level of price resistance, it will likely get another leg higher and follow the DJIA. Otherwise, look for $TRAN to drag down the DJIA. |
|
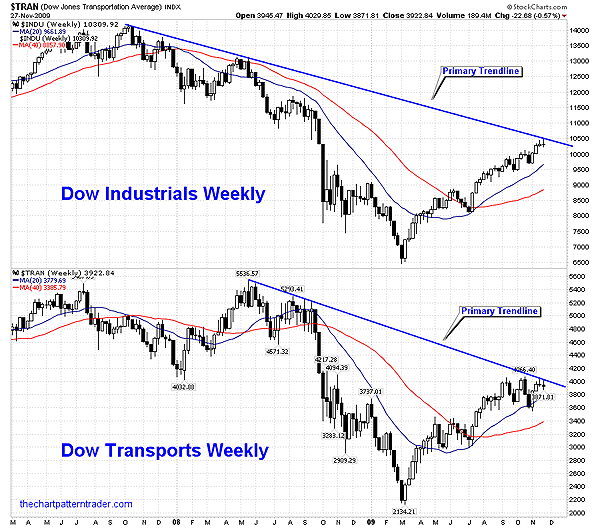
| FIGURE 2: $INDU, $TRAN, WEEKLY. Weekly charts are presented with linear price scaling. The odds favor a reversal as the indexes have crashed into the declining primary trendlines. The narrow range candles near the trendline suggest that upside momentum is waning. |
| Graphic provided by: StockCharts.com. |
| |
| However, as we look for signs of a resolution in price direction, let's consider another clue found on the weekly chart. In Figure 2, we see the weekly charts of Dow Jones Industrial Average alongside the $TRAN. Both have come right up to their primary trendlines drawn from peaks made during their historical highs. Both averages have produced candles of incision at their respective primary trendlines. The DJIA printed a doji and $TRAN got a spinning top, suggesting that a correction could begin to take off the weekly trendlines. This adds credibility to the bearish signs on the daily chart of the transports. But if for some reason the bears cannot regain control and the rectangle has a bullish resolution, we could witness a breakout of the primary trendline. To summarize, the transports not only have to combat with horizontal resistance in the daily time frame, they also have mammoth resistance in the weekly time frame after slamming right into the primary trendline. This hurdle may prove to be too much for $TRAN and may usher in an overdue correction. The transports are tradable via the iShares DJ Transportation Average Index Fund (IYT), seeking to mirror the performance of $TRAN. |
Ron Walker is an active trader and technical analyst. He operates an educational website dedicated to the study of Technical Analysis. The website offers free market analysis with daily video presentations and written commentaries. Ron is a video pioneer, being one of the first to utilize the internet producing Technical Analysis videos. His website is thechartpatterntrader.com
| Website: | thechartpatterntrader.com |
| E-mail address: | thechartpatterntrader@gmail.com |
Click here for more information about our publications!
Comments
Date:�12/02/09Rank:�4Comment:�

Request Information From Our Sponsors
- StockCharts.com, Inc.
- Candle Patterns
- Candlestick Charting Explained
- Intermarket Technical Analysis
- John Murphy on Chart Analysis
- John Murphy's Chart Pattern Recognition
- John Murphy's Market Message
- MurphyExplainsMarketAnalysis-Intermarket Analysis
- MurphyExplainsMarketAnalysis-Visual Analysis
- StockCharts.com
- Technical Analysis of the Financial Markets
- The Visual Investor
- VectorVest, Inc.
- Executive Premier Workshop
- One-Day Options Course
- OptionsPro
- Retirement Income Workshop
- Sure-Fire Trading Systems (VectorVest, Inc.)
- Trading as a Business Workshop
- VectorVest 7 EOD
- VectorVest 7 RealTime/IntraDay
- VectorVest AutoTester
- VectorVest Educational Services
- VectorVest OnLine
- VectorVest Options Analyzer
- VectorVest ProGraphics v6.0
- VectorVest ProTrader 7
- VectorVest RealTime Derby Tool
- VectorVest Simulator
- VectorVest Variator
- VectorVest Watchdog