HOT TOPICS LIST
- MACD
- Fibonacci
- RSI
- Gann
- ADXR
- Stochastics
- Volume
- Triangles
- Futures
- Cycles
- Volatility
- ZIGZAG
- MESA
- Retracement
- Aroon
INDICATORS LIST
LIST OF TOPICS
PRINT THIS ARTICLE
by Mike Carr, CMT
We'll combine RSI, the rate of change indicator, and Bollinger bands in a different way to see if crude oil is likely to move up or down.
Position: N/A
Mike Carr, CMT
Mike Carr, CMT, is a member of the Market Technicians Association, and editor of the MTA's newsletter, Technically Speaking. He is also the author of "Smarter Investing in Any Economy: The Definitive Guide to Relative Strength Investing," and "Conquering the Divide: How to Use Economic Indicators to Catch Stock Market Trends."
PRINT THIS ARTICLE
STRATEGIES
Analyzing Crude Oil
12/01/09 09:20:17 AMby Mike Carr, CMT
We'll combine RSI, the rate of change indicator, and Bollinger bands in a different way to see if crude oil is likely to move up or down.
Position: N/A
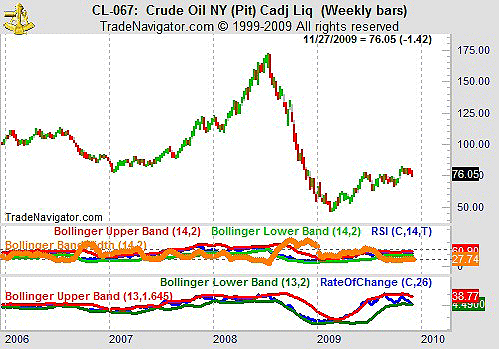
| Figure 1 is a weekly chart of crude oil. In the upper frame is the price. The middle frame shows the relative strength index (RSI), using the past 14 weeks for the calculation, and the bottom frame shows the 26-week rate of change. Bollinger bands are placed around both indicators. Bollinger BandWidth is also calculated for the RSI. |

|
| FIGURE 1: CRUDE OIL, WEEKLY. This weekly chart of crude oil indicates that a downward move is more likely than a continuing bull market. |
| Graphic provided by: Trade Navigator. |
| |
| In prices, we know that periods of low volatility tend to be followed by periods of high volatility. We see the same pattern for momentum. In this chart, RSI is used to tell us whether we are likely to see high or low momentum. A high momentum move is better for earning quick trading profits. The Bollinger BandWidth is at a one-year low and declining. That indicates a period of high momentum is due. |
| The rate of change is at the lower Bollinger band. This indicator tends to move along the bands (John Bollinger calls this "walking the bands") as price trends. |
| With momentum likely to increase and the rate of change at the lower band, the next big move in oil is likely to be down. This type of analysis can be applied to any stock or commodity and combines well-known indicators in a unique way to see what they are really saying. |
Mike Carr, CMT, is a member of the Market Technicians Association, and editor of the MTA's newsletter, Technically Speaking. He is also the author of "Smarter Investing in Any Economy: The Definitive Guide to Relative Strength Investing," and "Conquering the Divide: How to Use Economic Indicators to Catch Stock Market Trends."
| Website: | www.moneynews.com/blogs/MichaelCarr/id-73 |
| E-mail address: | marketstrategist@gmail.com |
Click here for more information about our publications!
Comments
Date: 12/02/09Rank: 4Comment:

Request Information From Our Sponsors
- VectorVest, Inc.
- Executive Premier Workshop
- One-Day Options Course
- OptionsPro
- Retirement Income Workshop
- Sure-Fire Trading Systems (VectorVest, Inc.)
- Trading as a Business Workshop
- VectorVest 7 EOD
- VectorVest 7 RealTime/IntraDay
- VectorVest AutoTester
- VectorVest Educational Services
- VectorVest OnLine
- VectorVest Options Analyzer
- VectorVest ProGraphics v6.0
- VectorVest ProTrader 7
- VectorVest RealTime Derby Tool
- VectorVest Simulator
- VectorVest Variator
- VectorVest Watchdog
- StockCharts.com, Inc.
- Candle Patterns
- Candlestick Charting Explained
- Intermarket Technical Analysis
- John Murphy on Chart Analysis
- John Murphy's Chart Pattern Recognition
- John Murphy's Market Message
- MurphyExplainsMarketAnalysis-Intermarket Analysis
- MurphyExplainsMarketAnalysis-Visual Analysis
- StockCharts.com
- Technical Analysis of the Financial Markets
- The Visual Investor
