HOT TOPICS LIST
- MACD
- Fibonacci
- RSI
- Gann
- ADXR
- Stochastics
- Volume
- Triangles
- Futures
- Cycles
- Volatility
- ZIGZAG
- MESA
- Retracement
- Aroon
INDICATORS LIST
LIST OF TOPICS
PRINT THIS ARTICLE
by Paolo Pezzutti
At the end of a long downtrend, natural gas prices might rebound.
Position: N/A
Paolo Pezzutti
Author of the book "Trading the US Markets - A Comprehensive Guide to US Markets for International Traders and Investors" - Harriman House (July 2008)
PRINT THIS ARTICLE
TECHNICAL INDICATORS
US Natural Gas Fund ETF Double Bottom
12/01/09 09:49:22 AMby Paolo Pezzutti
At the end of a long downtrend, natural gas prices might rebound.
Position: N/A
| The US Natural Gas Fund exchange traded fund (UNG) is one of the most popular exchange traded commodity products as investors tried to gain exposure to natural gas prices. If you bought the natural gas fund assuming that it would follow the commodity's performance, you would be wrong. In fact, since last September, UNG underperformed significantly the spot price of the commodity. The reason is that it follows the percentage change in the price of the commodity's front-month contract. UNG invests in near-month futures contracts, rolling its holdings to the second-month futures contracts as expiration nears. The problem? The market is in contango. In this situation, longer-term contracts are priced higher than near-term contracts and the fund underperforms the underlying commodity. The result is disappointing for those who invested in the fund. If the wide contango spread reduces to historical levels, then UNG will come back in line with the natural gas pricing. However, some say that the fund is too big and, because futures roll every month, there is no way this can ever occur. It is an interesting example of product "inefficiency." Given its size (with inflows of almost $5 billion this year), UNG manages a huge volume of futures contracts each month, drawing the attention of regulators concerned about the possible distortion of prices. At www.unitedstatesnaturalgasfund.com, you can find information about this fund that at the moment is invested in January 2010 futures. |
| In addition to the technical issues of the funds, there are fundamental issues with natural gas that are interesting. Shale gas horizontal drilling technology has smashed the price of natural gas. Horizontal drilling is often used with shale gas wells, with lateral lengths up to 5,000 feet. Technology is having a profound effect on price and supply. In fact, shale gas has become an increasingly important source of natural gas in the US and interest has spread to potential gas shales in other continents, expanding worldwide energy supply. We are witnessing an increasing in production of natural gas and currently, storage of gas in the US is at its high due also to a mild autumn. Historically, oil and gas traded with good correlation, but because of these facts the ratio of prices reached new highs last summer. Prices of oil recovered to almost $80 and natural gas did not follow this trend. It is true, however, that natural gas spot prices are sensitive to changes in climate and lack of sunspot activity could mean a cold winter. Other political factors can influence the price of gas such as last year's events between Russia and Ukraine and the subsequent intention of Europeans to seek different arrangements that would reduce their dependence on Russian gas. |

|
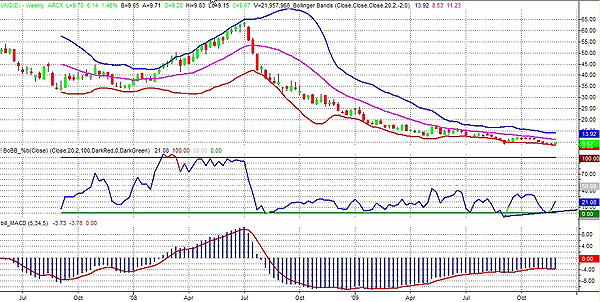
| FIGURE 1: UNG, WEEKLY. Prices developed an impressive downtrend since 2008. Indicators display a positive divergence that may indicate prices are near a bottom. |
| Graphic provided by: TradeStation. |
| |
| In the weekly chart in Figure 1, you can see how prices of UNG went down sharply from a high of $63.89 in April 2008 to the present price of $9.67. I applied also the %b indicator, which is derived from the Bollinger bands. It measures where the last price is in relation to the bands and it tells us where we are within the bands. This indicator, together with MACD, is displaying a positive divergence in this time frame. |

|
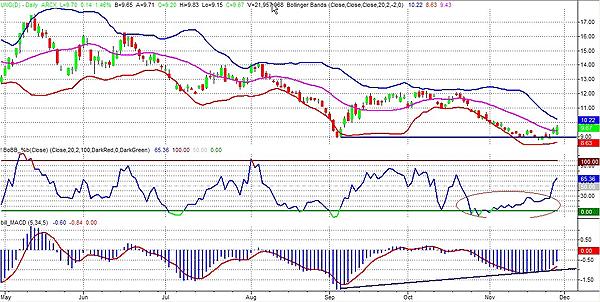
| FIGURE 2: UNG, DAILY. UNG is printing a positive divergence of the MACD and %b indicators. The failure of the breakout to new lows could initiate a positive reaction. |
| Graphic provided by: TradeStation. |
| |
| If we move to the daily chart in Figure 2, we can see that prices attempted to break out the low of $8.94 printed on September 2, 2009. The breakout has not been successful so far and after printing a low of $8.80 on November 20, prices developed a fast rebound to the present value of $9.67. In particular, last Thursday UNG printed a 6% rebound. There is a positive divergence of the %b indicator and also of the moving average convergence/divergence (MACD). In the short term, prices should reach the descending upper Bollinger bands that currently is at 10.22, but an objective of the move could be at $11. If prices move below $8.80, we will see another selloff. |

|
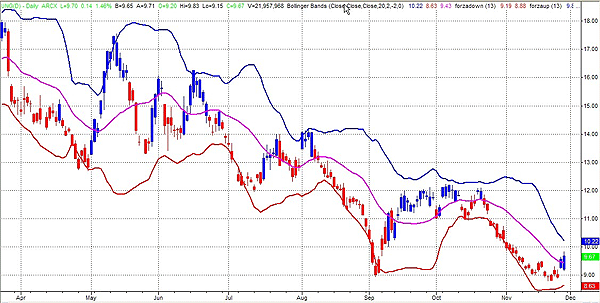
| FIGURE 3: UNG, DAILY. The force index has turned positive after a long down leg. |
| Graphic provided by: TradeStation. |
| |
| On the daily chart in Figure 3, I used the force index indicator, which is an indicator measuring the force of bulls during uptrends and the force of bears in downtrends. It takes into account price and volume. I applied a 13-day exponential moving average (EMA) of the force index to help track the trend. When the trend is positive, the color is blue; when the trend is negative, the color is red. The force index indicator turned positive. After a long downleg, it could mean that UNG could finally develop a reaction to the upside. There are several questions related to natural gas, such as what happens to prices when the expected correction in commodities occurs. The fact the UNG systematically underperforms the spot price of natural gas is also a problem. Moreover, fundamentals are not in favor of natural gas, as production is increasing. Finally, tempreratures have been mild so far in the US and storage is increasing. Technically, I think natural gas might be an interesting opportunity to be considered at these levels for a contrarian trade, given the volatility that a reaction to the upside could develop. However, risk is high on this trade. |
Author of the book "Trading the US Markets - A Comprehensive Guide to US Markets for International Traders and Investors" - Harriman House (July 2008)
| Address: | VIA ROBERTO AGO 26 POSTAL CODE 00166 |
| Rome, ITALY | |
| Phone # for sales: | +393357540708 |
| E-mail address: | pezzutti.paolo@tiscali.it |
Click here for more information about our publications!
Comments
Date: 12/02/09Rank: 4Comment:
Date: 12/08/09Rank: 1Comment: I don t know why one would want to even mention this losing ETF (UNG) which has been systematically underperforming the related commodity. Since this article UNG is of course back to new lows, while Nat Gas is doing better...

Request Information From Our Sponsors
- StockCharts.com, Inc.
- Candle Patterns
- Candlestick Charting Explained
- Intermarket Technical Analysis
- John Murphy on Chart Analysis
- John Murphy's Chart Pattern Recognition
- John Murphy's Market Message
- MurphyExplainsMarketAnalysis-Intermarket Analysis
- MurphyExplainsMarketAnalysis-Visual Analysis
- StockCharts.com
- Technical Analysis of the Financial Markets
- The Visual Investor
- VectorVest, Inc.
- Executive Premier Workshop
- One-Day Options Course
- OptionsPro
- Retirement Income Workshop
- Sure-Fire Trading Systems (VectorVest, Inc.)
- Trading as a Business Workshop
- VectorVest 7 EOD
- VectorVest 7 RealTime/IntraDay
- VectorVest AutoTester
- VectorVest Educational Services
- VectorVest OnLine
- VectorVest Options Analyzer
- VectorVest ProGraphics v6.0
- VectorVest ProTrader 7
- VectorVest RealTime Derby Tool
- VectorVest Simulator
- VectorVest Variator
- VectorVest Watchdog
