HOT TOPICS LIST
- MACD
- Fibonacci
- RSI
- Gann
- ADXR
- Stochastics
- Volume
- Triangles
- Futures
- Cycles
- Volatility
- ZIGZAG
- MESA
- Retracement
- Aroon
INDICATORS LIST
LIST OF TOPICS
PRINT THIS ARTICLE
by Chaitali Mohile
After a short-term bearish reversal pattern appeared on the daily chart, the Russell 2000 Small Cap Index turned weaker. The recovery is likely to be sluggish.
Position: N/A
Chaitali Mohile
Active trader in the Indian stock markets since 2003 and a full-time writer. Trading is largely based upon technical analysis.
PRINT THIS ARTICLE
DOUBLE TOPS
Russell 2000 At Crucial Levels
11/30/09 01:17:39 PMby Chaitali Mohile
After a short-term bearish reversal pattern appeared on the daily chart, the Russell 2000 Small Cap Index turned weaker. The recovery is likely to be sluggish.
Position: N/A
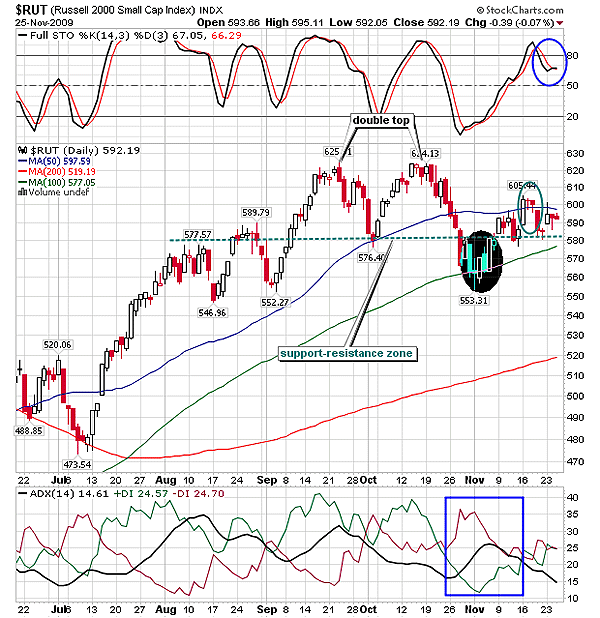
| On the daily time frame in Figure 1, the Russell 2000 Small Cap Index ($RUT) formed a double top -- a bearish reversal pattern, suggesting the end of an existing bullish rally. The two tops were formed at 625 and 624 levels. Since the second peak was formed in a short span of three to four weeks, we consider the pattern to be short term. From the very beginning of the bullish rally of $RUT, the full stochastic (14,3,3) was unable to sustain in an overbought region. Similarly, when the double top was formed on the price chart, the oscillator slipped from an overbought region. The frequent fall of the oscillator from the bullish region developed strong volatility during the entire bullish rally. So every upward price action is followed by a bearish rally in Figure 1. Before the double top was formed, the index formed two higher peaks at 577 and 589, setting up a strong support-resistance zone for the rally. We can see that the trough between the double top at 625 and 624 established support at 576 levels. The interception of the 50-day moving average (MA) at the same level (576) made it a robust support. |

|
| FIGURE 1: $RUT, DAILY. According to the indicators and the support-resistance on the price charts, the index is likely to remain in a crucial range. |
| Graphic provided by: StockCharts.com. |
| |
| Therefore, the bearish breakout of the pattern had two immediate supports of the ascending 50-day MA and the previous support at 576. Gradually, both the supports were breached and the index retraced toward the next robust support of the 100-day MA. By the time the third support was challenged, $RUT lost almost 60 points. The stochastic oscillator in Figure 1 moved into a highly oversold zone below 20, indicating the possibility of a pullback rally. The average directional movement index (ADX) (14) that was highlighting a developing downtrend reversed with marginally increased buying pressure. In fact, the downtrend did not reverse, but equal buying and selling pressure added high volatility in the current pullback rally. Therefore, the upward price action with the support of the 100-day MA showed reluctance to surge above the 50-day MA resistance. |
| Since the past few days, $RUT has been moving in a volatile range under the resistance of the 50-day MA and the support of 576 (support-resistance zone). The marked candles show a bullish day followed by a doji and a small hanging man. The doji and hanging man were formed below the previous high of 605, showing a strong bearish hold, which may be why the rally did not breach resistance. The full stochastic (14,3,3) is bullish, although the oscillator has slipped from a highly overbought region of 80. Therefore, the index is likely to hold intermediate support of the 100-day MA. The converging positive directional index (+DI) and the negative directional index (-DI) suggests the rangebound price action would continue. Due to the crucial consolidation range, the recovery would be sluggish. |
| If $RUT comes back to test support at 552/553 level, then there is a possibility of a left shoulder being constructed; 577 and 587 would be the right shoulders, and the double top would be multiple heads. The multiple head & shoulders formation on the daily time frame in Figure 1 is a rare possibility. Traders should remain watchful under such circumstances. Till the 100-day MA support is held, $RUT would remain in a consolidation mood. |
Active trader in the Indian stock markets since 2003 and a full-time writer. Trading is largely based upon technical analysis.
| Company: | Independent |
| Address: | C1/3 Parth Indraprasth Towers. Vastrapur |
| Ahmedabad, Guj 380015 | |
| E-mail address: | chaitalimohile@yahoo.co.in |
Traders' Resource Links | |
| Independent has not added any product or service information to TRADERS' RESOURCE. | |
Click here for more information about our publications!
Comments
Date: 12/01/09Rank: 2Comment:

Request Information From Our Sponsors
- VectorVest, Inc.
- Executive Premier Workshop
- One-Day Options Course
- OptionsPro
- Retirement Income Workshop
- Sure-Fire Trading Systems (VectorVest, Inc.)
- Trading as a Business Workshop
- VectorVest 7 EOD
- VectorVest 7 RealTime/IntraDay
- VectorVest AutoTester
- VectorVest Educational Services
- VectorVest OnLine
- VectorVest Options Analyzer
- VectorVest ProGraphics v6.0
- VectorVest ProTrader 7
- VectorVest RealTime Derby Tool
- VectorVest Simulator
- VectorVest Variator
- VectorVest Watchdog
- StockCharts.com, Inc.
- Candle Patterns
- Candlestick Charting Explained
- Intermarket Technical Analysis
- John Murphy on Chart Analysis
- John Murphy's Chart Pattern Recognition
- John Murphy's Market Message
- MurphyExplainsMarketAnalysis-Intermarket Analysis
- MurphyExplainsMarketAnalysis-Visual Analysis
- StockCharts.com
- Technical Analysis of the Financial Markets
- The Visual Investor
