HOT TOPICS LIST
- MACD
- Fibonacci
- RSI
- Gann
- ADXR
- Stochastics
- Volume
- Triangles
- Futures
- Cycles
- Volatility
- ZIGZAG
- MESA
- Retracement
- Aroon
INDICATORS LIST
LIST OF TOPICS
PRINT THIS ARTICLE
by Donald W. Pendergast, Jr.
Low-priced stocks (those trading below $5 per share) can be difficult to trade, due to poor liquidity and low institutional sponsorship. However, once in a while an outstanding trade setup takes shape in one of these, one worthy of a long-term investor's consideration.
Position: N/A
Donald W. Pendergast, Jr.
Donald W. Pendergast is a financial markets consultant who offers specialized services to stock brokers and high net worth individuals who seek a better bottom line for their portfolios.
PRINT THIS ARTICLE
MOVING AVERAGES
Vantage Drilling: A Stock In Search Of A Breakout
11/30/09 09:24:05 AMby Donald W. Pendergast, Jr.
Low-priced stocks (those trading below $5 per share) can be difficult to trade, due to poor liquidity and low institutional sponsorship. However, once in a while an outstanding trade setup takes shape in one of these, one worthy of a long-term investor's consideration.
Position: N/A
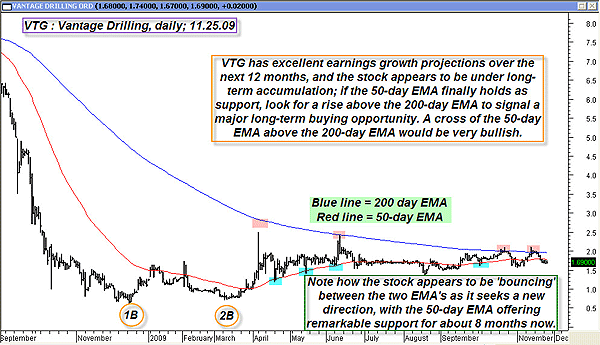
| Houston, TX–based Vantage Drilling (VTG) saw its stock price take a mighty tumble during 2008, bottoming out near $0.60 per share in December 2008. Since then, the stock has formed a double-bottom pattern (see Figure 1 for circled "1B" and "2B" markers), slowly but surely grinding higher, despite several sharp retracements lower from the 200-day exponential moving average (EMA). That's not surprising given the extent of the drop in the price of this stock, all the way from $8.44 down to $0.60. The real question now: Is this basing/accumulation pattern in VTG the real deal? |

|
| FIGURE 1: VTG, DAILY. With two key EMAs approaching convergence, the big question now for VTG traders/investors is "Which way now?" The stock is projected to earn $0.13 per share within the next year, far above the current quarterly estimate; that may provide a clue as to the next big move in this stock. |
| Graphic provided by: MetaStock. |
| |
| Figure 1 is the daily graph for VTG. The real item of interest on this chart, however, is the tenacious grip that VTG has been maintaining on its 50-day EMA, barely straying at all from it on the downside, which is very bullish in this overall technical context. Also note how the spread between these two key EMAs continues to narrow; at some point, the stock is going to have to decide which side of the 200-day EMA line it wishes to reside on, and, based on the overall look of this chart pattern, a savvy technician would be prepared to go long this stock (as a longer-term investment position, not a short-term trade) upon a successful daily close above the 200-day EMA, perhaps using the 50-day EMA as an initial/trailing stop. Then, if the stock completes a golden cross (50-day EMA crossing the 200-day EMA to the upside), such a technician would wait for the first suitable retracement back to key support (either a 21- or 50-day EMA) and then adding on to the position. |
| Stocks with solid earnings growth projections (like this one) are terrific long-term trade candidates, especially if they can launch higher from such a pronounced, long-term basing/accumulation pattern like the one we see here. The key to success is to not overcommit trading capital to such a trade, especially at the start, given that we're talking about a $1.69 stock here. Risking no more than 0.5% to 1% of your trading equity might be a useful guideline as far as deciding how much to commit to such a trade. If the worst happens and you get stopped out by the 50-day EMA after entering on a 200-day EMA breakout, your risk will be fairly low anyway and you can either wait for a better setup in VTG or just move on to something more promising. After all, the markets offer a nonstop array of trading opportunities every day for those who know how to identify them, quantify them, and then act upon them without hesitation. |
Donald W. Pendergast is a financial markets consultant who offers specialized services to stock brokers and high net worth individuals who seek a better bottom line for their portfolios.
| Title: | Writer, market consultant |
| Company: | Linear Trading Systems LLC |
| Jacksonville, FL 32217 | |
| Phone # for sales: | 904-239-9564 |
| E-mail address: | lineartradingsys@gmail.com |
Traders' Resource Links | |
| Linear Trading Systems LLC has not added any product or service information to TRADERS' RESOURCE. | |
Click here for more information about our publications!
Comments
Date: 12/01/09Rank: 4Comment:
Date: 02/26/10Rank: 5Comment:

Request Information From Our Sponsors
- StockCharts.com, Inc.
- Candle Patterns
- Candlestick Charting Explained
- Intermarket Technical Analysis
- John Murphy on Chart Analysis
- John Murphy's Chart Pattern Recognition
- John Murphy's Market Message
- MurphyExplainsMarketAnalysis-Intermarket Analysis
- MurphyExplainsMarketAnalysis-Visual Analysis
- StockCharts.com
- Technical Analysis of the Financial Markets
- The Visual Investor
- VectorVest, Inc.
- Executive Premier Workshop
- One-Day Options Course
- OptionsPro
- Retirement Income Workshop
- Sure-Fire Trading Systems (VectorVest, Inc.)
- Trading as a Business Workshop
- VectorVest 7 EOD
- VectorVest 7 RealTime/IntraDay
- VectorVest AutoTester
- VectorVest Educational Services
- VectorVest OnLine
- VectorVest Options Analyzer
- VectorVest ProGraphics v6.0
- VectorVest ProTrader 7
- VectorVest RealTime Derby Tool
- VectorVest Simulator
- VectorVest Variator
- VectorVest Watchdog
