HOT TOPICS LIST
- MACD
- Fibonacci
- RSI
- Gann
- ADXR
- Stochastics
- Volume
- Triangles
- Futures
- Cycles
- Volatility
- ZIGZAG
- MESA
- Retracement
- Aroon
INDICATORS LIST
LIST OF TOPICS
PRINT THIS ARTICLE
by Koos van der Merwe
Let's face it: the Apple iPhone is wonderful, but when you are talking to a client and they ask you for a phone number, you cannot look for it without disconnecting.
Position: Buy
Koos van der Merwe
Has been a technical analyst since 1969, and has worked as a futures and options trader with First Financial Futures in Johannesburg, South Africa.
PRINT THIS ARTICLE
GAPS
RIM, The Anti-iPhone
11/25/09 09:14:58 AMby Koos van der Merwe
Let's face it: the Apple iPhone is wonderful, but when you are talking to a client and they ask you for a phone number, you cannot look for it without disconnecting.
Position: Buy
| And that is where RIM succeeds with its Blackberry and Storm II, not as fancy as the iPhone with its thousands of apps, but user-friendly for the businessman who needs to talk to clients and at the same time view data sources or available applications. Blackberry adherents are not put off by the iPhone or even the Motorola Droid. |

|
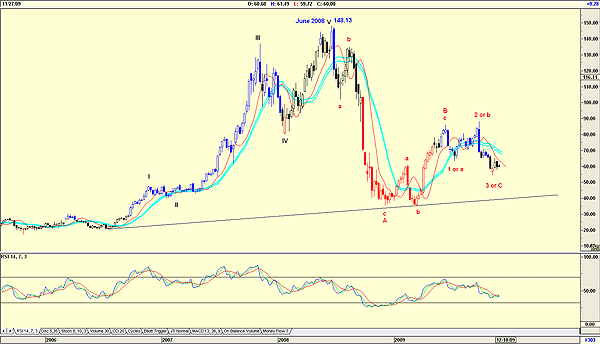
| FIGURE 1: RIM, WEEKLY. Here's an unusual wave count. |
| Graphic provided by: AdvancedGET. |
| |
| Figure 1, a weekly chart, can be confusing. This is because the wave count is out of the ordinary. Usually an A-wave correction is a simple abc correction, with the C-wave correction as a five-wave impulse correction. However, the chart does suggest that the A-wave in the case of the weekly chart of RIMM is a five-wave impulse correction, which means that the C-wave will be an abc correction. This form of count is very rare, something I have only seen rarely in my years of wave analysis. It does have the disadvantage of feeding the bears, and at the moment, rumors are circulating that RIM is in financial trouble. Remarkably enough, this should be bullish, not bearish. |

|
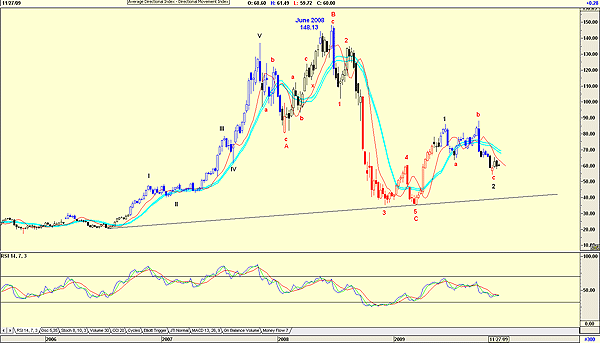
| FIGURE 2: RIM, WEEKLY. Here's a preferred wave count. |
| Graphic provided by: AdvancedGET. |
| |
| So that leads me to my second wave count, which shows a B-wave greater than wave V (Figure 2). Of course, this could be more acceptable, especially because it ties in with an upmove for RIMM, which is what we could expect with either a takeover as rumored or the success of Storm II. This suggests that wave 3 of a major upmove could be in the offing. Note in both charts that the relative strength index (RSI) did give a buy signal January 2, 2009, and although it has fallen, it did not give a sell signal. So let us see what a daily chart can tell us. |

|
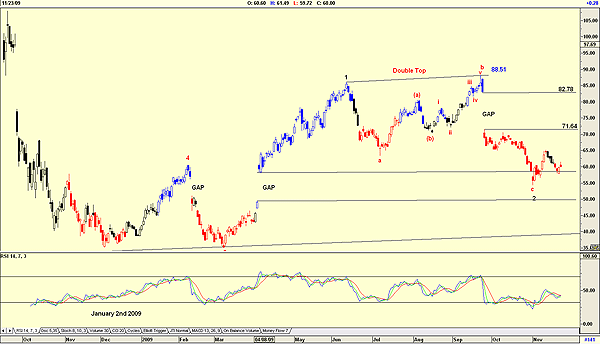
| FIGURE 3: RIM, DAILY. This suggests a buy. |
| Graphic provided by: AdvancedGET. |
| |
| Figure 3, the daily chart, shows a double top at 88.51, which is a strong deterrent. However, should the price move up to test that level from the present $60, it would offer a very nice return. Note the number of gaps on the chart and how the price has fallen to fill the gap, and that it should now rise to fill the gap between 71.64 and 82 .78. Further, note that the RSI has given a buy signal. My charts are suggesting that RIM is worth a buy at present levels, whether on the US market or the Canadian one. |
Has been a technical analyst since 1969, and has worked as a futures and options trader with First Financial Futures in Johannesburg, South Africa.
| Address: | 3256 West 24th Ave |
| Vancouver, BC | |
| Phone # for sales: | 6042634214 |
| E-mail address: | petroosp@gmail.com |
Click here for more information about our publications!
Comments
Date: 11/27/09Rank: 3Comment:

Request Information From Our Sponsors
- VectorVest, Inc.
- Executive Premier Workshop
- One-Day Options Course
- OptionsPro
- Retirement Income Workshop
- Sure-Fire Trading Systems (VectorVest, Inc.)
- Trading as a Business Workshop
- VectorVest 7 EOD
- VectorVest 7 RealTime/IntraDay
- VectorVest AutoTester
- VectorVest Educational Services
- VectorVest OnLine
- VectorVest Options Analyzer
- VectorVest ProGraphics v6.0
- VectorVest ProTrader 7
- VectorVest RealTime Derby Tool
- VectorVest Simulator
- VectorVest Variator
- VectorVest Watchdog
- StockCharts.com, Inc.
- Candle Patterns
- Candlestick Charting Explained
- Intermarket Technical Analysis
- John Murphy on Chart Analysis
- John Murphy's Chart Pattern Recognition
- John Murphy's Market Message
- MurphyExplainsMarketAnalysis-Intermarket Analysis
- MurphyExplainsMarketAnalysis-Visual Analysis
- StockCharts.com
- Technical Analysis of the Financial Markets
- The Visual Investor
