HOT TOPICS LIST
- MACD
- Fibonacci
- RSI
- Gann
- ADXR
- Stochastics
- Volume
- Triangles
- Futures
- Cycles
- Volatility
- ZIGZAG
- MESA
- Retracement
- Aroon
INDICATORS LIST
LIST OF TOPICS
PRINT THIS ARTICLE
by Mike Carr, CMT
With the broad market still about 30% below its all-time highs, retailers are actually a little stronger and are only 25% off theirs.
Position: N/A
Mike Carr, CMT
Mike Carr, CMT, is a member of the Market Technicians Association, and editor of the MTA's newsletter, Technically Speaking. He is also the author of "Smarter Investing in Any Economy: The Definitive Guide to Relative Strength Investing," and "Conquering the Divide: How to Use Economic Indicators to Catch Stock Market Trends."
PRINT THIS ARTICLE
STRATEGIES
Are Retail Stocks Signaling Tougher Times Ahead?
11/24/09 09:23:04 AMby Mike Carr, CMT
With the broad market still about 30% below its all-time highs, retailers are actually a little stronger and are only 25% off theirs.
Position: N/A
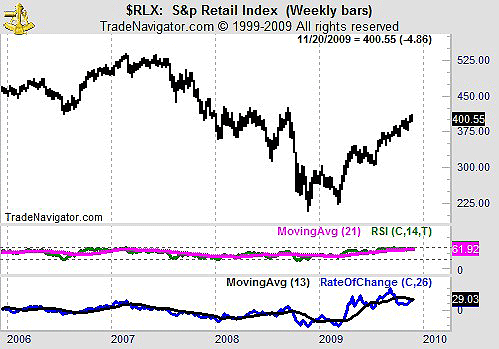
| The broad market is more than 65% off its March lows. Retailers, as measured by the S&P Retail Index, have almost doubled from a year ago. They reached their lows in November 2008 and are more than 90% above those levels. |
| Now, this sector is stalling just like the overall market. Traditional momentum indicators such as stochastics and the moving average convergence/divergence (MACD) are showing a bearish divergence with price. In Figure 1, we see that the relative strength index (RSI) and the rate of change are also giving bearish warnings. |

|
| FIGURE 1:$RLX, WEEKLY. This chart of the S&P Retail Index shows that prices and momentum have stalled. |
| Graphic provided by: Trade Navigator. |
| |
| The RSI is just above its long-term moving average. This is an indication that the trend in momentum is about to change. The 26-week rate of change has already fallen below its short-term moving average. This signal often precedes a price decline. |
| This is an important sector to watch for clues on the overall economy. About 70% of the US economy is consumer spending, much of which takes place at the stores that make up this index. It is hard to see how there can be an economic recovery, or a sustained bull market, with these stocks leading the way. |
Mike Carr, CMT, is a member of the Market Technicians Association, and editor of the MTA's newsletter, Technically Speaking. He is also the author of "Smarter Investing in Any Economy: The Definitive Guide to Relative Strength Investing," and "Conquering the Divide: How to Use Economic Indicators to Catch Stock Market Trends."
| Website: | www.moneynews.com/blogs/MichaelCarr/id-73 |
| E-mail address: | marketstrategist@gmail.com |
Click here for more information about our publications!
Comments
Date: 11/25/09Rank: 4Comment:

Request Information From Our Sponsors
- StockCharts.com, Inc.
- Candle Patterns
- Candlestick Charting Explained
- Intermarket Technical Analysis
- John Murphy on Chart Analysis
- John Murphy's Chart Pattern Recognition
- John Murphy's Market Message
- MurphyExplainsMarketAnalysis-Intermarket Analysis
- MurphyExplainsMarketAnalysis-Visual Analysis
- StockCharts.com
- Technical Analysis of the Financial Markets
- The Visual Investor
- VectorVest, Inc.
- Executive Premier Workshop
- One-Day Options Course
- OptionsPro
- Retirement Income Workshop
- Sure-Fire Trading Systems (VectorVest, Inc.)
- Trading as a Business Workshop
- VectorVest 7 EOD
- VectorVest 7 RealTime/IntraDay
- VectorVest AutoTester
- VectorVest Educational Services
- VectorVest OnLine
- VectorVest Options Analyzer
- VectorVest ProGraphics v6.0
- VectorVest ProTrader 7
- VectorVest RealTime Derby Tool
- VectorVest Simulator
- VectorVest Variator
- VectorVest Watchdog
