HOT TOPICS LIST
- MACD
- Fibonacci
- RSI
- Gann
- ADXR
- Stochastics
- Volume
- Triangles
- Futures
- Cycles
- Volatility
- ZIGZAG
- MESA
- Retracement
- Aroon
INDICATORS LIST
LIST OF TOPICS
PRINT THIS ARTICLE
by David Penn
A head and shoulders top threatens to send gold toward a test of multi-year lows.
Position: N/A
David Penn
Technical Writer for Technical Analysis of STOCKS & COMMODITIES magazine, Working-Money.com, and Traders.com Advantage.
PRINT THIS ARTICLE
HEAD & SHOULDERS
Gold's Glitter Gone
11/20/01 10:00:41 AMby David Penn
A head and shoulders top threatens to send gold toward a test of multi-year lows.
Position: N/A
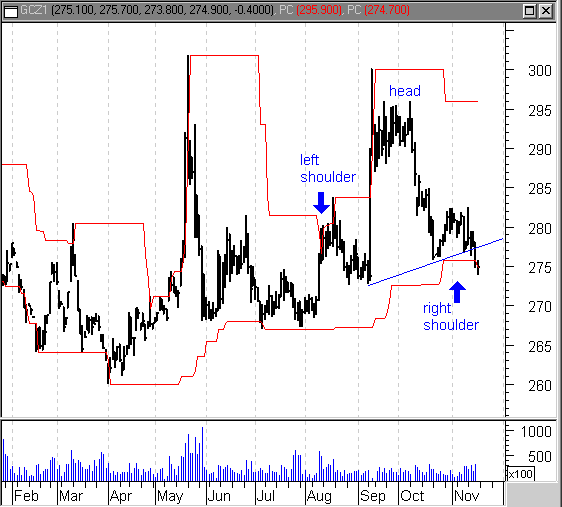
| Before speculating about the intermediate term head and shoulders pattern developing in the December gold contract, it is worth pointing out that gold is only recently off major historical lows. At 272, gold is 7% off the year-to-date high of 295, 15% off the three-year of 315, and 36% off its six-year high of 425, set at the beginning of 1996. There are few downtrends more pronounced (though a few in Japan come to mind) than gold's downtrend since 1996. |
| At the same time, gold has seen something of a rally in 2001. After making a bottom in mid-1999, gold rallied swiftly before resuming its descent during 2000. The current intermediate head and shoulders top, which began in August, peaked in mid-September and looks to be breaking down in late November, comes on the tail end of the 2001 rally. While it may be true that gold was due for a rally, given the persistence of its multi-year downtrend, the declining economy, lackluster stock market and terrorist fears in 2001 are the most likely catalysts for gold's recent run. By mid-2001, gold's rally meant that a downtrend line stretching back to the 1996 peak was broken. |

|
| This intermediate head and shoulders top may mean a quick retest of the year-to-date lows. |
| Graphic provided by: MetaStock. |
| |
| However it is difficult to make the case for gold bullishness. While the early 2001 lows--to date-- represent a successful test of the 1999 lows, gold is in many ways still too close to those lows (up 7% from 2001 low of 260). A continued rally--one that at least tested if not took out the October high at 294--would be necessary to make a case for consolidation near the lows, to say nothing of a new bull market in gold. |
| Should gold continue its current descent, the intermediate head and shoulders pattern have developed at the end of the summer could see prices drop as low as 260, a major long-term low. This price target is based on the current formation size of the H&S top in December gold, which features an upwardly sloping neckline at approximately 276/277 and a formation peak just north of 294. |
| The chart provided also includes a 30-day price channel to highlight the fact that December gold is also making fresh 30-day lows. Having avoided 30-day low territory during its last decline in August, gold's continued movement through the bottom line of the 30-day price channel is a bearish development for the yellow metal. Beyond the 30-day low, some support exists for gold at 273 and again at 268. The 268 area in particular is a significant area insofar as it marks the most recent enduring low for the contract. |
Technical Writer for Technical Analysis of STOCKS & COMMODITIES magazine, Working-Money.com, and Traders.com Advantage.
| Title: | Technical Writer |
| Company: | Technical Analysis, Inc. |
| Address: | 4757 California Avenue SW |
| Seattle, WA 98116 | |
| Phone # for sales: | 206 938 0570 |
| Fax: | 206 938 1307 |
| Website: | www.Traders.com |
| E-mail address: | DPenn@traders.com |
Traders' Resource Links | |
| Charting the Stock Market: The Wyckoff Method -- Books | |
| Working-Money.com -- Online Trading Services | |
| Traders.com Advantage -- Online Trading Services | |
| Technical Analysis of Stocks & Commodities -- Publications and Newsletters | |
| Working Money, at Working-Money.com -- Publications and Newsletters | |
| Traders.com Advantage -- Publications and Newsletters | |
| Professional Traders Starter Kit -- Software | |
Click here for more information about our publications!
Comments
Date: 11/24/01Rank: 3Comment: I just bougtht 6000 shares of PDG
so obviously we differ in our interpretation..but then thats what makes the market,doesnt it.
WHY BUY NOW.?..CCI/Stoi is in BUY
terrritory=very low.
Also..what TIME element ar we talking about. I am bascially a DAY TRADER...sometimes a week.
What is your TIME LINE?
Best Wishes..Its an ART as well as a SCIENCE.
John Wekerle - Trading for 30 years
sage3711@mediaone.net
Date: 11/28/01Rank: 5Comment:

Request Information From Our Sponsors
- StockCharts.com, Inc.
- Candle Patterns
- Candlestick Charting Explained
- Intermarket Technical Analysis
- John Murphy on Chart Analysis
- John Murphy's Chart Pattern Recognition
- John Murphy's Market Message
- MurphyExplainsMarketAnalysis-Intermarket Analysis
- MurphyExplainsMarketAnalysis-Visual Analysis
- StockCharts.com
- Technical Analysis of the Financial Markets
- The Visual Investor
- VectorVest, Inc.
- Executive Premier Workshop
- One-Day Options Course
- OptionsPro
- Retirement Income Workshop
- Sure-Fire Trading Systems (VectorVest, Inc.)
- Trading as a Business Workshop
- VectorVest 7 EOD
- VectorVest 7 RealTime/IntraDay
- VectorVest AutoTester
- VectorVest Educational Services
- VectorVest OnLine
- VectorVest Options Analyzer
- VectorVest ProGraphics v6.0
- VectorVest ProTrader 7
- VectorVest RealTime Derby Tool
- VectorVest Simulator
- VectorVest Variator
- VectorVest Watchdog
