HOT TOPICS LIST
- MACD
- Fibonacci
- RSI
- Gann
- ADXR
- Stochastics
- Volume
- Triangles
- Futures
- Cycles
- Volatility
- ZIGZAG
- MESA
- Retracement
- Aroon
INDICATORS LIST
LIST OF TOPICS
PRINT THIS ARTICLE
by Donald W. Pendergast, Jr.
Sometimes gold outperforms gold mining stocks and sometimes it's the other way around. What might be the next moves in these different venues of the precious metals markets?
Position: N/A
Donald W. Pendergast, Jr.
Donald W. Pendergast is a financial markets consultant who offers specialized services to stock brokers and high net worth individuals who seek a better bottom line for their portfolios.
PRINT THIS ARTICLE
REL. STR COMPARATIVE
Go With Gold Or Gold Stocks?
11/20/09 09:24:36 AMby Donald W. Pendergast, Jr.
Sometimes gold outperforms gold mining stocks and sometimes it's the other way around. What might be the next moves in these different venues of the precious metals markets?
Position: N/A
| Both gold (GLD, GC) and the stocks related to the gold mining industry (HUI, GDX) have outperformed the broad markets since making their respective lows a little more than a year ago. However, while gold has made a new nominal high, the gold mining stocks have not as yet been able to do so. Let's look at a couple of charts and see if we can discern if there are any precautionary steps that gold bugs should be thinking about, just in case another selloff begins to wrack these markets again. |

|
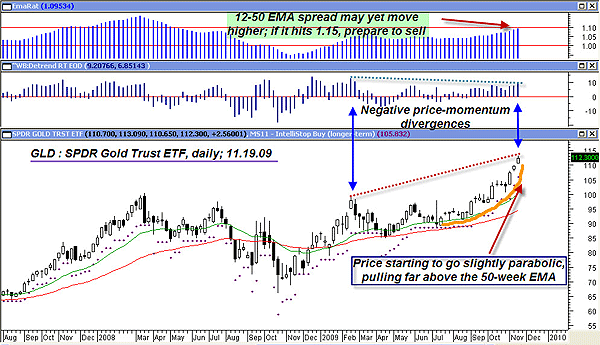
| FIGURE 1: GLD, DAILY. While it's foolish to call a top in any market, wise traders will still use caution when a market appears to have gone too far, too fast. A pullback toward $100 may offer another solid buying opportunity for patient investors. |
| Graphic provided by: MetaStock. |
| Graphic provided by: WB Detrend EOD from ProfitTrader for MetaStock. |
| |
| Long term, the fundamentals for the gold (and silver) market appear to be without peer; they're even better than they were in the 1970s when gold ran from $35 all the way to $878 in about nine years. Silver did great too, running from about $2 to $54 during the same time span. The fundamentals for these two metals were outstanding in 2008 too, just before gold plunged from $1,031 to $713 and silver took an even bigger dive in percentage terms, from nearly $21 all the way down to $8 and change. I'm not suggesting that the next selloff in gold and silver will be as extreme as the one witnessed in 2008, but be rest assured, a correction will happen at some point, probably sooner than most gold bugs would anticipate. With that assertion in mind, take a look at the current daily chart for GLD (Figure 1). Price is beginning to go parabolic (that is, an unsustainable rate of rise) and the detrend oscillator is clearly showing that a negative price momentum divergence is already in place. Meanwhile, the spread between the 12-week and the 50-week exponential moving averages (EMAs), as depicted by the EMA ratio (EMARat) indicator at the top of the chart, is beginning to ascend into historically high levels, although still below the all-time highs achieved in early 2008. So, if you're long cash gold, gold futures, or GLD, you need to be running fairly close stops, especially if you're a latecomer to this massive 2009 runup in the metals market. When gold eventually sells off again (count on it), it will likely fall harder and faster than you may imagine, probably down to prior support above the recent monthly breakout at about $1,025 on the cash gold chart and about $100 on the GLD chart. The metals could be a great buy again at those levels, but anyone adding long positions right now needs to be classified as a professional gambler, given all of the highly reliable warning signs emanating from Figure 1. |

|
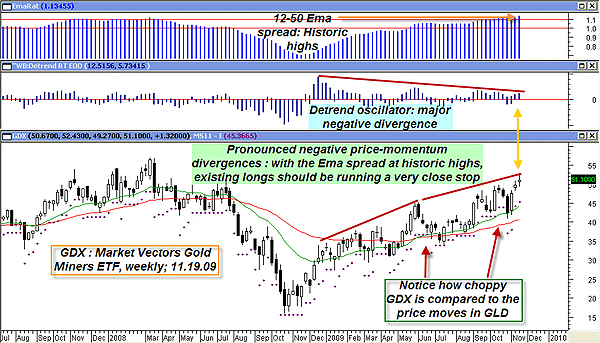
| FIGURE 2: GDX, WEEKLY. Gold mining stocks are likely to correct harder than gold itself, if history is any guide. A selloff back toward $42 or $40 might also offer gold bugs another chance to go long. |
| Graphic provided by: MetaStock. |
| Graphic provided by: WB Detrend RT EOD from ProfitTrader. |
| |
| Now, Figure 2 is an even more disturbing chart, this time of GDX, the exchange traded fund (ETF) that tracks the price performance of all the significant players in the gold mining industry group. Here, we see that the EMARat spread is at a new extreme; the negative price momentum divergence between price and the detrend oscillator has become more noticeable than a flashing neon billboard in Times Square. Also of note is that gold is at new nominal (but not inflation-adjusted) highs but gold mining stocks are not; they're still well below the price levels attained in early 2008. It's also important to note that gold stocks are more susceptible to downdrafts in the broad equity markets, no matter what gold is doing. GDX is also very choppy and indecisive as it seeks to carve out new up- and downtrends, especially when compared to the price of gold, which might actually make cash gold a better trend-following instrument than the gold mining stocks. The mining stocks seem to be great for short-term swing moves on a daily trading time frame, but they are too crazy to trade in a Turtle-style channel breakout system, even on a weekly trading time frame. |
| Bottom line: with near-record commercial short positions in both the gold and silver futures markets, traders need to be prepared for the next round of selling in the precious metals markets. The charts have given us ample warning of what may soon transpire in these particular markets and now it's up to us to act on that information in a responsible and profit-enhancing/loss-limiting manner. |
Donald W. Pendergast is a financial markets consultant who offers specialized services to stock brokers and high net worth individuals who seek a better bottom line for their portfolios.
| Title: | Writer, market consultant |
| Company: | Linear Trading Systems LLC |
| Jacksonville, FL 32217 | |
| Phone # for sales: | 904-239-9564 |
| E-mail address: | lineartradingsys@gmail.com |
Traders' Resource Links | |
| Linear Trading Systems LLC has not added any product or service information to TRADERS' RESOURCE. | |
Click here for more information about our publications!
Comments
Date: 11/20/09Rank: 4Comment:
Date: 11/22/09Rank: 5Comment:

Request Information From Our Sponsors
- StockCharts.com, Inc.
- Candle Patterns
- Candlestick Charting Explained
- Intermarket Technical Analysis
- John Murphy on Chart Analysis
- John Murphy's Chart Pattern Recognition
- John Murphy's Market Message
- MurphyExplainsMarketAnalysis-Intermarket Analysis
- MurphyExplainsMarketAnalysis-Visual Analysis
- StockCharts.com
- Technical Analysis of the Financial Markets
- The Visual Investor
- VectorVest, Inc.
- Executive Premier Workshop
- One-Day Options Course
- OptionsPro
- Retirement Income Workshop
- Sure-Fire Trading Systems (VectorVest, Inc.)
- Trading as a Business Workshop
- VectorVest 7 EOD
- VectorVest 7 RealTime/IntraDay
- VectorVest AutoTester
- VectorVest Educational Services
- VectorVest OnLine
- VectorVest Options Analyzer
- VectorVest ProGraphics v6.0
- VectorVest ProTrader 7
- VectorVest RealTime Derby Tool
- VectorVest Simulator
- VectorVest Variator
- VectorVest Watchdog
