HOT TOPICS LIST
- MACD
- Fibonacci
- RSI
- Gann
- ADXR
- Stochastics
- Volume
- Triangles
- Futures
- Cycles
- Volatility
- ZIGZAG
- MESA
- Retracement
- Aroon
INDICATORS LIST
LIST OF TOPICS
PRINT THIS ARTICLE
by Koos van der Merwe
All economists have two hands. What are the chances of one of those hands being wrong regarding a double-dip recession?
Position: Accumulate
Koos van der Merwe
Has been a technical analyst since 1969, and has worked as a futures and options trader with First Financial Futures in Johannesburg, South Africa.
PRINT THIS ARTICLE
ELLIOTT WAVE
A Double-Dip Recession?
11/19/09 01:07:35 PMby Koos van der Merwe
All economists have two hands. What are the chances of one of those hands being wrong regarding a double-dip recession?
Position: Accumulate
| The recession of the 1930s took a number of years to resolve itself, with a double-dip recession playing itself out. Many economists today are equating the present recession with that of the 1930s and forecasting that a double-dip recession will occur. My Elliott wave charts are calling for that double dip to be a Wave II correction, which can be and usually is a 72% correction. There is at least one difference between 2010 and 1930. If my wave count is correct -- and I believe that it is -- then the Wave II expected sometime in 2010, probably after May, will be a failure. It could be a simple correction and not very deep. Here's why. |

|
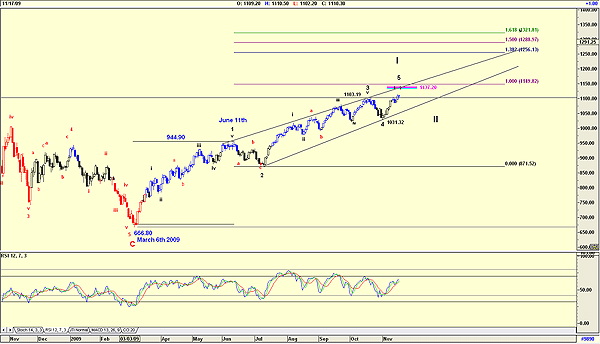
| FIGURE 1: S&P 500, MONTHLY |
| Graphic provided by: AdvancedGET. |
| |
| Figure 1 is of the Standard & Poor's 500, and my current reading is as follows. I say "current reading" because as Elliotticians know, the Elliott wave is a signpost in the wilderness and can change direction as the road it follows twists and turns. -On March 6, 2009, the S&P 500 bottomed at 666.80. The 666 alone on March 6 is ominous in itself (to certain believers), but in this instance it suggested that a C-wave bottom of a major correction had been correctly read. -On June 11, at 944.90 Wave 1 of Wave I topped, and was followed by Wave 2 of Wave I. Wave 2 was reasonably complicated, which means that wave 4 will be either a very complicated wave or a simple wave. Wave 4 as shown, if I am correct in my count, was a simple correction. -This means that the S&P 500 is now in a wave 5 of Wave I. This is where the complication arises. Wave 1 of Wave I is 278.10 in length (944.90 - 666.80 = 278.10). This means that wave 3 of Wave I should not be less than 278.10 in length. Wave 3 of Wave I is 231.67 long (1103.19 - 871.52 = 231.67), which is less than Wave 1 of Wave I. This means that Wave 5 of Wave I should be less than Wave 3 of Wave I. My wave projections are targeting 1137.20 as the top of Wave 5 of Wave I. -If this count is correct, then this means that the Wave II correction will be somewhere between 1103.19 and 1031.32. Taking the worst situation, this means a correction of 9.31% (1137.20 - 1031.32/1031.32), not all that bad when one considers the 50%-odd correction of a double-dip recession. -Note the relative strength index (RSI), which is still rising. When will this occur? Look at the Gann fan chart (Figure 2). |

|
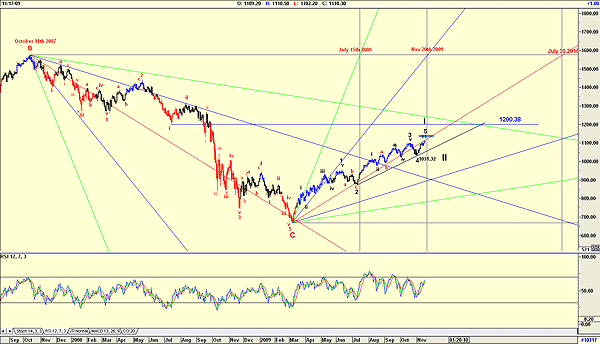
| FIGURE 2: GANN FANN OF S&P 500 |
| Graphic provided by: AdvancedGET. |
| |
| For this chart I have drawn a Gann Fan down from the high of October 11, 2007, the B-wave top to the low of the C-wave bottom. I have also drawn a horizontal line at this high. Using the same parameters, I have drawn a Gann fan upward, and I look to see where the fan lines cross the horizontal. The first date (green fan line) crossed the horizontal on July 15, 2009. Note that Wave 2 of Wave I bottomed two days after this date. The Gann fan is suggesting two other dates, November 20, 2009, and July 30, 2010. Will November 20 be the top of Wave 5 of Wave I with July 30, 2010, as the bottom of Wave II? If so, then my count is definitely out of kilter, unless Wave II is an extremely complicated wave or if July 30 will be the top of Wave 5 of Wave I. If this is the case, then Wave 5 is going to be painfully long for such a short rise. Then again, my fifth-wave projection could be wrong, and the resistance at 1200.38 as shown, could be the Wave 5 of Wave I top. Whatever the final outcome, we do know that the S&P 500 is in an uptrend, and that a correction, possibly similar to the recent small indecisive corrections that are occurring continually, could happen. We also know that November to May/July are usually good months for a rising market. Tax-loss selling, for example, will be complete. The next few weeks should be a good indication of the future trend. |
Has been a technical analyst since 1969, and has worked as a futures and options trader with First Financial Futures in Johannesburg, South Africa.
| Address: | 3256 West 24th Ave |
| Vancouver, BC | |
| Phone # for sales: | 6042634214 |
| E-mail address: | petroosp@gmail.com |
Click here for more information about our publications!
Comments
Date: 11/20/09Rank: 4Comment:
Date: 11/24/09Rank: 5Comment: Koos,
Have a great Thanksgiving
Dick Slayton

Request Information From Our Sponsors
- StockCharts.com, Inc.
- Candle Patterns
- Candlestick Charting Explained
- Intermarket Technical Analysis
- John Murphy on Chart Analysis
- John Murphy's Chart Pattern Recognition
- John Murphy's Market Message
- MurphyExplainsMarketAnalysis-Intermarket Analysis
- MurphyExplainsMarketAnalysis-Visual Analysis
- StockCharts.com
- Technical Analysis of the Financial Markets
- The Visual Investor
- VectorVest, Inc.
- Executive Premier Workshop
- One-Day Options Course
- OptionsPro
- Retirement Income Workshop
- Sure-Fire Trading Systems (VectorVest, Inc.)
- Trading as a Business Workshop
- VectorVest 7 EOD
- VectorVest 7 RealTime/IntraDay
- VectorVest AutoTester
- VectorVest Educational Services
- VectorVest OnLine
- VectorVest Options Analyzer
- VectorVest ProGraphics v6.0
- VectorVest ProTrader 7
- VectorVest RealTime Derby Tool
- VectorVest Simulator
- VectorVest Variator
- VectorVest Watchdog
