HOT TOPICS LIST
- MACD
- Fibonacci
- RSI
- Gann
- ADXR
- Stochastics
- Volume
- Triangles
- Futures
- Cycles
- Volatility
- ZIGZAG
- MESA
- Retracement
- Aroon
INDICATORS LIST
LIST OF TOPICS
PRINT THIS ARTICLE
by Chaitali Mohile
Traders are likely to get a fresh trading opportunity with the breakout of StreetTracks Gold Trust Shares.
Position: Buy
Chaitali Mohile
Active trader in the Indian stock markets since 2003 and a full-time writer. Trading is largely based upon technical analysis.
PRINT THIS ARTICLE
HEAD & SHOULDERS
Head & Shoulders For GLD
11/18/09 01:27:18 PMby Chaitali Mohile
Traders are likely to get a fresh trading opportunity with the breakout of StreetTracks Gold Trust Shares.
Position: Buy
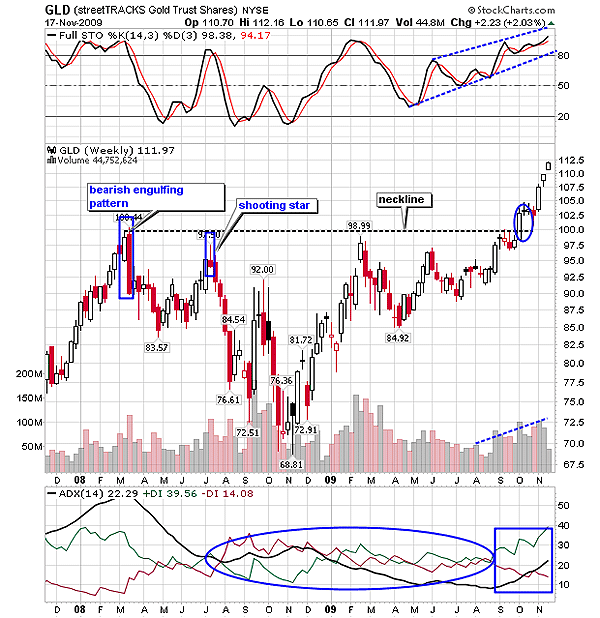
| The StreetTRACKS Gold Trust Shares (GLD) formed a classic inverted head & shoulders pattern on the weekly time frame in Figure 1. These days, the pattern is commonly found on charts on the weekly time frame of many indexes. But the reliability of the pattern breakout remains firm. Major indexes have witnessed a bullish breakout of the pattern, and currently, they are heading higher. Similar is the case of GLD. In Figure 1, the first decline for the stock was initiated by a bearish engulfing candlestick pattern in 2008. The overbought stochastic (14,3,3) and overheated average directional movement index (ADX)(14) reconfirmed the candlestick formation. GLD began a downward journey from $100. Later, the descending price established support at $83 and moved toward the previous high. Due to the newly developed downtrend, the bearish force was indicated by a shooting star -- a single bearish reversal candlestick pattern in Figure 1. The candlestick pattern suggested the end of an existing upward rally. |

|
| FIGURE 1: GLD, WEEKLY. The inverted head & shoulder breakout has dragged GLD to new highs. After the breakout, the volume has increased and the uptrend has developed as well. |
| Graphic provided by: StockCharts.com. |
| |
| Hence, GLD plunged further with the series of lower lows. We can see the buying and selling pressure indicated by the positive directional index (+DI) and negative directional index (-DI) of ADX (14) had a tough time establishing themselves. This generated high volatility during the declining rally. Volume reduced dramatically till the lowest support at $68 was formed. However, the pullback rally from the new low started on encouraging volume and soon hit the previous high resistance at $98. GLD retraced from the resistance area, highlighting the neckline of an inverted head & shoulders formation. The volume during the right shoulder formation was relatively high, thus reconfirming the pattern. The stochastic oscillator formed higher highs and higher lows, indicating the bullish momentum that was being developed. In addition, the weak ADX (14) (marked with an oval) moved vertically upward along with +DI. These developing bullish sentiments dragged GLD from the third bottom (right shoulder) toward the neckline resistance. |
| The developing bullish sentiments resulted in a bullish breakout of the pattern in Figure 1. Increased volume during the breakout helped GLD sustain above the newly formed neckline support and surge higher. The breakout point was the best buying opportunity for long-term traders, with the target of 98 - 68 = 30 + 98 = 128. Here, the potential target is measured by adding the length of the head (distance from neckline to lowest low = 30) to the neckline 98. Therefore, those already long can hold their positions, and the fresh trade can be entered once the stock turns sideways. |
| Thus, GLD is one stock to consider for a long position. |
Active trader in the Indian stock markets since 2003 and a full-time writer. Trading is largely based upon technical analysis.
| Company: | Independent |
| Address: | C1/3 Parth Indraprasth Towers. Vastrapur |
| Ahmedabad, Guj 380015 | |
| E-mail address: | chaitalimohile@yahoo.co.in |
Traders' Resource Links | |
| Independent has not added any product or service information to TRADERS' RESOURCE. | |
Click here for more information about our publications!
Comments
Date: 11/19/09Rank: 1Comment:
Date: 11/19/09Rank: 3Comment:

Request Information From Our Sponsors
- StockCharts.com, Inc.
- Candle Patterns
- Candlestick Charting Explained
- Intermarket Technical Analysis
- John Murphy on Chart Analysis
- John Murphy's Chart Pattern Recognition
- John Murphy's Market Message
- MurphyExplainsMarketAnalysis-Intermarket Analysis
- MurphyExplainsMarketAnalysis-Visual Analysis
- StockCharts.com
- Technical Analysis of the Financial Markets
- The Visual Investor
- VectorVest, Inc.
- Executive Premier Workshop
- One-Day Options Course
- OptionsPro
- Retirement Income Workshop
- Sure-Fire Trading Systems (VectorVest, Inc.)
- Trading as a Business Workshop
- VectorVest 7 EOD
- VectorVest 7 RealTime/IntraDay
- VectorVest AutoTester
- VectorVest Educational Services
- VectorVest OnLine
- VectorVest Options Analyzer
- VectorVest ProGraphics v6.0
- VectorVest ProTrader 7
- VectorVest RealTime Derby Tool
- VectorVest Simulator
- VectorVest Variator
- VectorVest Watchdog
