HOT TOPICS LIST
- MACD
- Fibonacci
- RSI
- Gann
- ADXR
- Stochastics
- Volume
- Triangles
- Futures
- Cycles
- Volatility
- ZIGZAG
- MESA
- Retracement
- Aroon
INDICATORS LIST
LIST OF TOPICS
PRINT THIS ARTICLE
by Mike Carr, CMT
The commercial advertisement says to buy natural gas now because it always goes up in the winter...but data shows that's only true for part of the winter.
Position: N/A
Mike Carr, CMT
Mike Carr, CMT, is a member of the Market Technicians Association, and editor of the MTA's newsletter, Technically Speaking. He is also the author of "Smarter Investing in Any Economy: The Definitive Guide to Relative Strength Investing," and "Conquering the Divide: How to Use Economic Indicators to Catch Stock Market Trends."
PRINT THIS ARTICLE
SEASONAL TRADING
Don't Always Take Investment Advice From The Radio
11/18/09 08:16:03 AMby Mike Carr, CMT
The commercial advertisement says to buy natural gas now because it always goes up in the winter...but data shows that's only true for part of the winter.
Position: N/A
| Every year about this time, advertisers tell a very logical story. As the temperatures drop, the demand for natural gas used to heat homes will rise. An increase in demand must mean there will be an increase in price, so the message is loud and clear: buy futures on natural gas and sell when everyone else is freezing. |
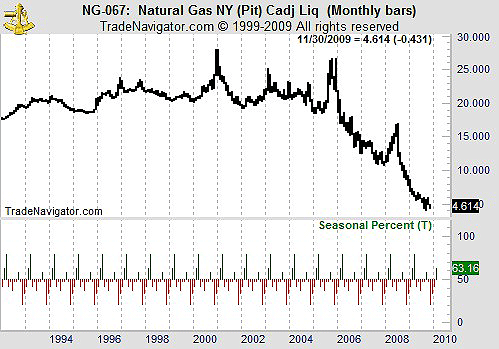
| In Figure 1, we see the monthly seasonal trend for natural gas futures. Each bar shows the percent of time that prices traded higher in that month of the year. For example, prices move higher 63% of the time in February and 79% of the time in March. The only other up month is September. |

|
| FIGURE 1: NG, MONTHLY. Natural gas futures show a strong downward bias based on seasonal tendencies. |
| Graphic provided by: Trade Navigator. |
| |
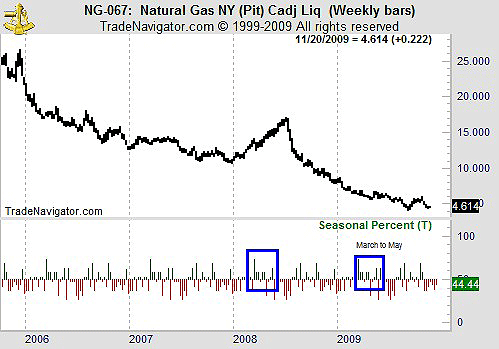
| The weekly chart (Figure 2) isn't much more bullish. In an average year, prices rise 23 weeks and fall the other 56% of the time. The most bullish time frame is in the late spring. |

|
| FIGURE 2: NG, WEEKLY. While most weeks are down, seasonals highlight the late spring as a bullish time of year for natural gas. |
| Graphic provided by: Trade Navigator. |
| |
| Based on seasonals, it might be better to wait for that buying opportunity. Futures trading is highly leveraged and the drawdown that could occur while you wait for that cold weather bounce could lead to a margin call. While there might be other reasons to buy natural gas now, listening to radio commercials certainly isn't one of them. |
Mike Carr, CMT, is a member of the Market Technicians Association, and editor of the MTA's newsletter, Technically Speaking. He is also the author of "Smarter Investing in Any Economy: The Definitive Guide to Relative Strength Investing," and "Conquering the Divide: How to Use Economic Indicators to Catch Stock Market Trends."
| Website: | www.moneynews.com/blogs/MichaelCarr/id-73 |
| E-mail address: | marketstrategist@gmail.com |
Click here for more information about our publications!
Comments
Date: 11/20/09Rank: 5Comment:

Request Information From Our Sponsors
- StockCharts.com, Inc.
- Candle Patterns
- Candlestick Charting Explained
- Intermarket Technical Analysis
- John Murphy on Chart Analysis
- John Murphy's Chart Pattern Recognition
- John Murphy's Market Message
- MurphyExplainsMarketAnalysis-Intermarket Analysis
- MurphyExplainsMarketAnalysis-Visual Analysis
- StockCharts.com
- Technical Analysis of the Financial Markets
- The Visual Investor
- VectorVest, Inc.
- Executive Premier Workshop
- One-Day Options Course
- OptionsPro
- Retirement Income Workshop
- Sure-Fire Trading Systems (VectorVest, Inc.)
- Trading as a Business Workshop
- VectorVest 7 EOD
- VectorVest 7 RealTime/IntraDay
- VectorVest AutoTester
- VectorVest Educational Services
- VectorVest OnLine
- VectorVest Options Analyzer
- VectorVest ProGraphics v6.0
- VectorVest ProTrader 7
- VectorVest RealTime Derby Tool
- VectorVest Simulator
- VectorVest Variator
- VectorVest Watchdog
