HOT TOPICS LIST
- MACD
- Fibonacci
- RSI
- Gann
- ADXR
- Stochastics
- Volume
- Triangles
- Futures
- Cycles
- Volatility
- ZIGZAG
- MESA
- Retracement
- Aroon
INDICATORS LIST
LIST OF TOPICS
PRINT THIS ARTICLE
by Mike Carr, CMT
Corn is up almost 30% in the last two months and soybeans show gains of almost 15% in the past five weeks.
Position: N/A
Mike Carr, CMT
Mike Carr, CMT, is a member of the Market Technicians Association, and editor of the MTA's newsletter, Technically Speaking. He is also the author of "Smarter Investing in Any Economy: The Definitive Guide to Relative Strength Investing," and "Conquering the Divide: How to Use Economic Indicators to Catch Stock Market Trends."
PRINT THIS ARTICLE
STRATEGIES
Time To Buy Grains?
11/18/09 08:22:15 AMby Mike Carr, CMT
Corn is up almost 30% in the last two months and soybeans show gains of almost 15% in the past five weeks.
Position: N/A
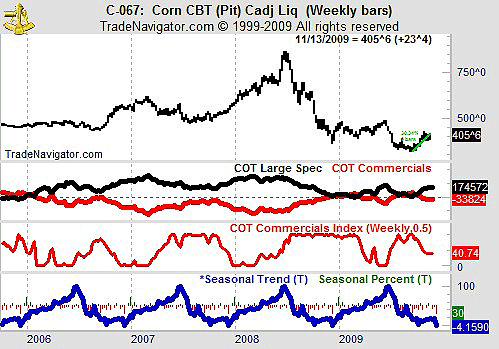
| News reports from the Midwest tell us that the harvest season has been challenging for farmers. Weather has made it tough to bring the crop in, and prices are moving higher on these concerns. We can see a sharp gain in corn prices (Figure 1) as traders likely reacted to the news. The chart for soybeans shows a similar pattern. |

|
| FIGURE 1: C, WEEKLY. This chart shows corn prices with COT data and seasonals. |
| Graphic provided by: Trade Navigator. |
| |
| In Figure 1, we see the data from the Commitment of Traders report for large speculators (black line) and commercial hedgers (red line). The speculators have been buying as prices rose, while hedgers have been selling. Hedgers use the product, and in this case would include food companies that want to get the best possible price on corn to help them keep their costs down. |
| Over the long term, hedgers tend to be right more often than not. As we can see in the chart, they buy low and sell, or at least avoid buying, at higher prices. But COT data can be difficult to determine. Larry Williams has developed an index that looks at the data in relation to where it has been over the past 26 weeks. The index simply represents the COT data as a percentage of its high over the past six months. This is shown in the middle clip of Figure 1. It's best to buy when the commercial index is low and turns higher. Note how commercials decreased buying as prices turned higher. |
| In the bottom of Figure 1, we see that this is a seasonally weak time of the year for grains. That doesn't mean prices can't go up; it just means that they usually don't. Given the weak seasonals, and the lack of buying among commercials, the price rise in grains is more likely to be near an end than a beginning. |
Mike Carr, CMT, is a member of the Market Technicians Association, and editor of the MTA's newsletter, Technically Speaking. He is also the author of "Smarter Investing in Any Economy: The Definitive Guide to Relative Strength Investing," and "Conquering the Divide: How to Use Economic Indicators to Catch Stock Market Trends."
| Website: | www.moneynews.com/blogs/MichaelCarr/id-73 |
| E-mail address: | marketstrategist@gmail.com |
Click here for more information about our publications!
PRINT THIS ARTICLE

Request Information From Our Sponsors
- StockCharts.com, Inc.
- Candle Patterns
- Candlestick Charting Explained
- Intermarket Technical Analysis
- John Murphy on Chart Analysis
- John Murphy's Chart Pattern Recognition
- John Murphy's Market Message
- MurphyExplainsMarketAnalysis-Intermarket Analysis
- MurphyExplainsMarketAnalysis-Visual Analysis
- StockCharts.com
- Technical Analysis of the Financial Markets
- The Visual Investor
- VectorVest, Inc.
- Executive Premier Workshop
- One-Day Options Course
- OptionsPro
- Retirement Income Workshop
- Sure-Fire Trading Systems (VectorVest, Inc.)
- Trading as a Business Workshop
- VectorVest 7 EOD
- VectorVest 7 RealTime/IntraDay
- VectorVest AutoTester
- VectorVest Educational Services
- VectorVest OnLine
- VectorVest Options Analyzer
- VectorVest ProGraphics v6.0
- VectorVest ProTrader 7
- VectorVest RealTime Derby Tool
- VectorVest Simulator
- VectorVest Variator
- VectorVest Watchdog
