HOT TOPICS LIST
- MACD
- Fibonacci
- RSI
- Gann
- ADXR
- Stochastics
- Volume
- Triangles
- Futures
- Cycles
- Volatility
- ZIGZAG
- MESA
- Retracement
- Aroon
INDICATORS LIST
LIST OF TOPICS
PRINT THIS ARTICLE
by Chaitali Mohile
Apple made an all-time high recently. Will the stock sustain at the new high or undergo a corrective rally?
Position: N/A
Chaitali Mohile
Active trader in the Indian stock markets since 2003 and a full-time writer. Trading is largely based upon technical analysis.
PRINT THIS ARTICLE
TECHNICAL ANALYSIS
Apple At New High
11/18/09 07:48:43 AMby Chaitali Mohile
Apple made an all-time high recently. Will the stock sustain at the new high or undergo a corrective rally?
Position: N/A
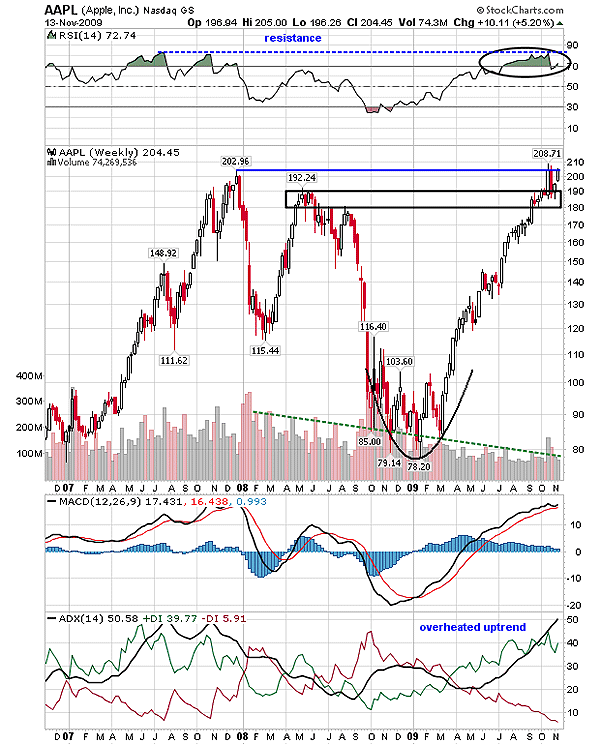
| Apple Inc. (AAPL) formed a top at $202 and if you look at the RSI(14) indicator plotted above the price chart you will see a negative divergence with price in 2007. The uptrend reversed and the stock plunged to a low at $115. However, the pullback rally from $115 recovered the lost levels and formed a lower high at $192. Although AAPL consolidated at $192, bearish forces dragged the price to lower lows, with the stock of AAPL losing almost 60% of its value. By 2008-09 the stock price of AAPL became highly oversold, indicating the possibility of a bullish reversal rally. We can see in Figure 1 that the stock formed a rounded bottom as fresh demand poured in and the moving average convergence divergence (MACD) (12,26,9) showed a bullish crossover in negative territory. The bullish crossover suggested that positive momentum was developing and the new upward movement could continue. The average directional movement index (ADX) (14) too reversed in the bull's favor, and as a result, AAPL successfully climbed to higher levels. |

|
| FIGURE 1: AAPL, WEEKLY. The current overheated uptrend would result in a small descending price rally from the new high. |
| Graphic provided by: StockCharts.com. |
| |
| Gradually, AAPL surged to previous highs on strong bullish sentiments. The stock consolidated during an upward journey, gathering the required strength for the rally. As a result, AAPL soon hit the previous high at $192 and $202. According to Figure 1, the earlier consolidation (2008) at $192 developed a resistance zone for the current bullish move. However, AAPL made an all-time high of $208 and moved sideways between $192 and $202. You can see from Figure 1 that the RSI (14) is overbought and the ADX (14) was highly overheated above the 50 levels. This tells you that the bulls may have run out of steam. In addition, the narrowed gap between the MACD and trigger line suggested declining bullish momentum. Another point of concern is the descending volume. Although the stock has hit a new high, the volume has not increased. Thus, the indicator suggests a minor decline from the new high. Therefore, I would recommend profit booking for the long positions and be watchful till $208 is converted to support. |
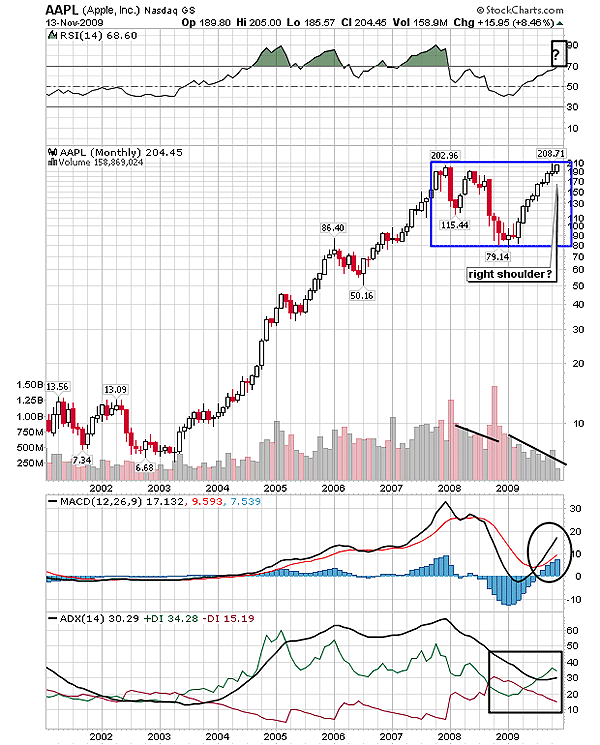
| AAPL has been in the robust uptrend since 2003. The prolonged bullish rally declined from $202 because the uptrend was overheated. The ADX (14) in Figure 2 moved in an overheated zone for more than two years. The RSI (14) formed a triple top, which is a bearish reversal formation. Two lower bottoms are currently visible on the monthly time frame in Figure 2. Is AAPL likely to form an inverted head & shoulders pattern? |

|
| FIGURE 2: AAPL, MONTHLY. If the stock plunges from the current level, then a right shoulder would appear on the chart. |
| Graphic provided by: StockCharts.com. |
| |
| The price formed new high at $208, but the RSI (14) failed to do the same. The ADX (14) has declined from an overheated area to a developing area. This suggests that the uptrend is developing on relatively weak buying pressure. As the rally was heading toward the new high, the size of bullish candles in Figure 2 shrank, indicating reducing bullish strength. However, long-term traders need not worry even if an inverted head & shoulders pattern is formed on the monthly chart as the pattern breaks upward. If the pattern is not formed and AAPL continues the existing advance rally, then positional long traders can hold the trade. Thus, in both cases, buyers are benefited. |
| To conclude, AAPL at its new high is likely to change direction either horizontally or vertically down for the next few weeks. |
Active trader in the Indian stock markets since 2003 and a full-time writer. Trading is largely based upon technical analysis.
| Company: | Independent |
| Address: | C1/3 Parth Indraprasth Towers. Vastrapur |
| Ahmedabad, Guj 380015 | |
| E-mail address: | chaitalimohile@yahoo.co.in |
Traders' Resource Links | |
| Independent has not added any product or service information to TRADERS' RESOURCE. | |
Click here for more information about our publications!
PRINT THIS ARTICLE

Request Information From Our Sponsors
- VectorVest, Inc.
- Executive Premier Workshop
- One-Day Options Course
- OptionsPro
- Retirement Income Workshop
- Sure-Fire Trading Systems (VectorVest, Inc.)
- Trading as a Business Workshop
- VectorVest 7 EOD
- VectorVest 7 RealTime/IntraDay
- VectorVest AutoTester
- VectorVest Educational Services
- VectorVest OnLine
- VectorVest Options Analyzer
- VectorVest ProGraphics v6.0
- VectorVest ProTrader 7
- VectorVest RealTime Derby Tool
- VectorVest Simulator
- VectorVest Variator
- VectorVest Watchdog
- StockCharts.com, Inc.
- Candle Patterns
- Candlestick Charting Explained
- Intermarket Technical Analysis
- John Murphy on Chart Analysis
- John Murphy's Chart Pattern Recognition
- John Murphy's Market Message
- MurphyExplainsMarketAnalysis-Intermarket Analysis
- MurphyExplainsMarketAnalysis-Visual Analysis
- StockCharts.com
- Technical Analysis of the Financial Markets
- The Visual Investor
