HOT TOPICS LIST
- MACD
- Fibonacci
- RSI
- Gann
- ADXR
- Stochastics
- Volume
- Triangles
- Futures
- Cycles
- Volatility
- ZIGZAG
- MESA
- Retracement
- Aroon
INDICATORS LIST
LIST OF TOPICS
PRINT THIS ARTICLE
by Ron Walker
Silver has had a nice run in recent months, but it could be time for prices to cool down. The iShares Silver Trust could be setting up a bearish head & shoulders top, but a trendline is standing in the way of the pattern. Let's explore the possibilities of where price might be contained should the trend break.
Position: N/A
Ron Walker
Ron Walker is an active trader and technical analyst. He operates an educational website dedicated to the study of Technical Analysis. The website offers free market analysis with daily video presentations and written commentaries. Ron is a video pioneer, being one of the first to utilize the internet producing Technical Analysis videos. His website is thechartpatterntrader.com
PRINT THIS ARTICLE
TREND-CHANNEL
Hi Ho Silver
11/16/09 09:54:29 AMby Ron Walker
Silver has had a nice run in recent months, but it could be time for prices to cool down. The iShares Silver Trust could be setting up a bearish head & shoulders top, but a trendline is standing in the way of the pattern. Let's explore the possibilities of where price might be contained should the trend break.
Position: N/A
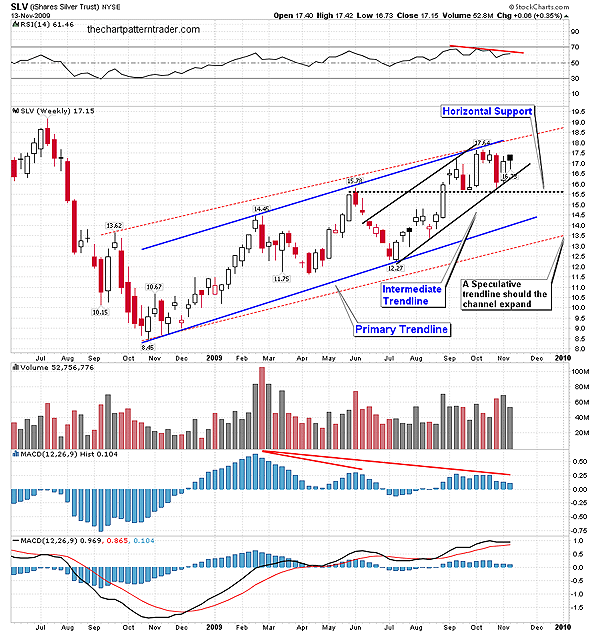
| In the thrilling days of yesteryear, the Lone Ranger fought for law and order in the Old West. He managed to catch all the outlaws thanks to his fast and fiery horse Silver, which moved with the speed of light, leaving behind a cloud of dust as the show's narrator exclaimed each week. Maybe the iShares Silver Trust (SLV) hasn't moved quite at the speed of light, or can't even keep up with the masked man's trusty horse, but the exchange traded fund (ETF) has been moving along at a pretty good clip. From the October 2008 low of $8.45 to the October 2009 high, SLV has more than doubled in one year's time (Figure 1). Currently, there are two rising trendlines that are in play on the weekly chart of SLV, the primary and the intermediate trendline. The basic concept of a trendline is simple; only two points are needed to draw a tentative trendline, but it is the third point that makes it a valid trendline. The significance of a trendline is determined by how many times it has been tested, how long it has been intact, and its angle of ascent. According to the rules of Dow theory, trendlines may be classified into three categories, major (primary), intermediate (secondary), or minor. Different classes of trendlines are used to define the various grades of trend. |

|
| FIGURE 1: SLV, WEEKLY. Here we see the intermediate trend channel of SLV (black solid lines) within the larger primary trend. The lower peak on the histogram hints of a coming correct that may test the primary trend or a sharp correction could cause the channel to expand to the speculative lower trendline (red dotted trendline). |
| Graphic provided by: StockCharts.com. |
| |
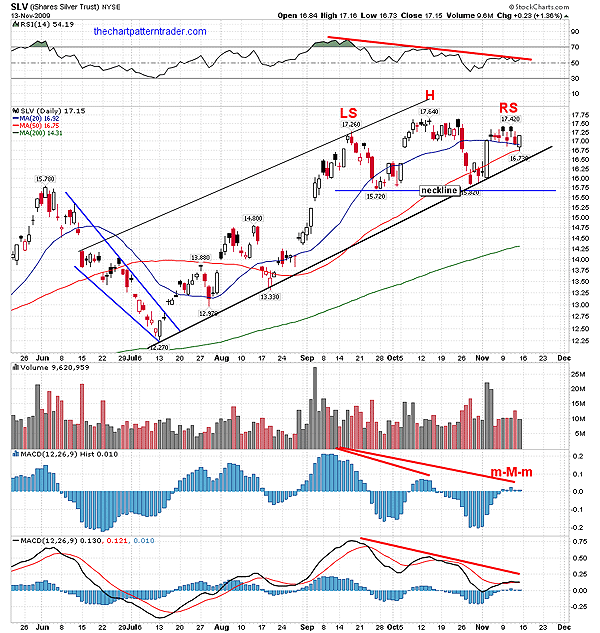
| In Figure 1, SLV's weekly chart shows a primary trendline that has had several points of contact as it was tested several times in late 2008 during the infancy stage of the trend, and then once again during the June–July 2009 correction, and it has been intact for over a year. In Figure 2, SLV's daily chart shows that the intermediate trendline has three points of contact and has been in place approximately four months. |

|
| FIGURE 2: SLV, DAILY. A possible head & shoulders pattern is being carved out on the daily chart. Lower peaks on all the indicators suggest that the trendline will be taken out as prices complete the right shoulder. |
| Graphic provided by: StockCharts.com. |
| |
| After the June–July correction, prices began to advance very rapidly, climbing at a steep ascent that formed a smaller channel within the larger one in the weekly time frame. This steeper trendline is classified as the intermediate trend. In Figure 2, SLV broke above the previous June peak by early September, and then backtested that breakout in September with a test to support that completed the left shoulder in a possible head & shoulders top. Prices then surged to fresh highs in October 2009, testing the upper channel lines to form the head. There, a reaction took place that took SLV back to test the September lows near the $15.75 area. This test allows us to speculate on a potential head & shoulders topping pattern, with a completed left shoulder and head. Once the head was completed by testing support, we were drawn to a potential neckline for the chart pattern. Note where the rising trendline and the horizontal support level intersected, giving SLV the bounce that it needed to set up a potential right shoulder. If a right shoulder is completed, it will break the intermediate trendline. That is the first of two events that must occur in order for the pattern to play out. The intermediate rising trendline must be broken and then prices must penetrate the neckline of the head & shoulders pattern at $15.75, which is where horizontal support resides. If both those levels of support are taken out, SLV will move back to the more sustainable slope of the primary trendline (lower blue line) (Figure 1). Because the current Intermediate trendline has accelerated too rapidly, causing SLV to rise approximately 44% since the June–July correction. This move has produced a rather steep angle of ascent, which is most likely unsustainable. |
| Channels often expand, as prices fall to a secondary, less steep trendline. Should a correction take place, the range of the primary channel could expand by moving below what is the current primary trendline. That would create two lower trendlines, an inner and an outer line. There are already two return lines. A return line is one that runs parallel with a trendline, where reactions originate (corrective moves against the prevailing trend). Now note the trendline drawn connecting the peak made in September 2008 to the most recent October high in 2009 (red dotted line). Annotated underneath that is a speculative lower parallel boundary that may serve as the outer trendline (red dotted line). A shakeout thrust or sharp bottom could push prices below the current primary trendline creating dual trendlines, which in return would also can create dual trend channels on the weekly chart of SLV. However, at that point, the true primary trendline would be the second, less steep trendline. So the extreme price movements between the outer trendline and the outer return line would be the true trend channel. Often, it isn't detectable until after the fact. So if the head & shoulders pattern runs its course, we very well could expand the current trend channel because the pattern measures of $1.92 points to a minimum target of $13.80, which could overshoot the current lower trendline on the weekly chart. That target is also in the neighborhood of the 200-period moving average on the daily chart, a crucial level of support. |
| Besides this, the daily chart of SLV (Figure 2) offers additional evidence that bearish chart pattern may short-circuit the recent advance. The right shoulder began to set up when an elongated candle formed as prices bounced off the intermediate trendline. After that, narrow range candlesticks appeared as the 20-period moving average began to slump over. Prices put in a lower peak, which could be a possible right shoulder. The narrow range bodies suggest that momentum is slowing. The relative strength index (RSI)(14) is testing its declining trendline. The RSI is pointing down and a lower high on SLV could create the third lower peak. The moving average convergence/divergence (MACD) (12, 26, 9) and the MACD histogram (12, 26, 9) also may put in a third lower peak. The weekly chart also has a bearish divergence on the histogram and a declining RSI trendline. There's an old saying that says "Trends are made to be broken." In that case, keep your eyes on the current intermediate trendline, because we are overdue for a correction. Let's see if the bears pull back the reins and slow this horse down. However, I don't think SLV is a one-trick pony. After a corrective move, it could go on to exceed its recent highs due to a weak dollar, mounting deficits, and the future expectation of inflation. But keep in mind that no trendlines have been broken yet, so at this time I'm speculating on the head & shoulders pattern running its course. |
Ron Walker is an active trader and technical analyst. He operates an educational website dedicated to the study of Technical Analysis. The website offers free market analysis with daily video presentations and written commentaries. Ron is a video pioneer, being one of the first to utilize the internet producing Technical Analysis videos. His website is thechartpatterntrader.com
| Website: | thechartpatterntrader.com |
| E-mail address: | thechartpatterntrader@gmail.com |
Click here for more information about our publications!
Comments
Date: 11/17/09Rank: 5Comment:

Request Information From Our Sponsors
- StockCharts.com, Inc.
- Candle Patterns
- Candlestick Charting Explained
- Intermarket Technical Analysis
- John Murphy on Chart Analysis
- John Murphy's Chart Pattern Recognition
- John Murphy's Market Message
- MurphyExplainsMarketAnalysis-Intermarket Analysis
- MurphyExplainsMarketAnalysis-Visual Analysis
- StockCharts.com
- Technical Analysis of the Financial Markets
- The Visual Investor
- VectorVest, Inc.
- Executive Premier Workshop
- One-Day Options Course
- OptionsPro
- Retirement Income Workshop
- Sure-Fire Trading Systems (VectorVest, Inc.)
- Trading as a Business Workshop
- VectorVest 7 EOD
- VectorVest 7 RealTime/IntraDay
- VectorVest AutoTester
- VectorVest Educational Services
- VectorVest OnLine
- VectorVest Options Analyzer
- VectorVest ProGraphics v6.0
- VectorVest ProTrader 7
- VectorVest RealTime Derby Tool
- VectorVest Simulator
- VectorVest Variator
- VectorVest Watchdog
