HOT TOPICS LIST
- MACD
- Fibonacci
- RSI
- Gann
- ADXR
- Stochastics
- Volume
- Triangles
- Futures
- Cycles
- Volatility
- ZIGZAG
- MESA
- Retracement
- Aroon
INDICATORS LIST
LIST OF TOPICS
PRINT THIS ARTICLE
by Chaitali Mohile
The immediate target for a particular stock or index can be measured by using simple technical tools or trendlines. A long-term and very short-term target for the DJIA can be identified using these simple techniques.
Position: Hold
Chaitali Mohile
Active trader in the Indian stock markets since 2003 and a full-time writer. Trading is largely based upon technical analysis.
PRINT THIS ARTICLE
TECHNICAL ANALYSIS
What's The Next Target For Dow?
11/12/09 01:09:29 PMby Chaitali Mohile
The immediate target for a particular stock or index can be measured by using simple technical tools or trendlines. A long-term and very short-term target for the DJIA can be identified using these simple techniques.
Position: Hold
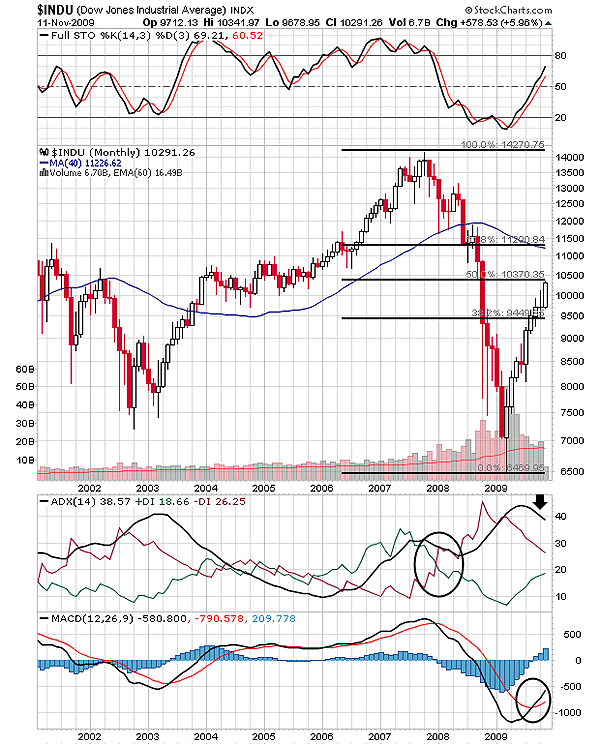
| Marking a high of 2007 and a low of 2009, the Fibonacci retracement level is drawn on the monthly chart of Dow Jones Industrial Average ($INDU) in Figure 1. The tool helps to note the potential support-resistance areas. According to the tool, $INDU has recovered up to 50% retracement level. The bullish rally from the 6470 level gradually reached the first retracement level at 38.2% on the strong bullish reversal signals from the full stochastic (14,3,3) and the highly overheated average directional movement index (ADX) (14). By the time a new low at 6470 was developed, $INDU had moved in a robust downtrend. The index turned highly oversold, suggesting a bullish rally ahead. Thus, these highly bearish conditions generated the bullish rally with an immense force. |
| Therefore, the descending overheated downtrend and upward movement of the stochastic oscillator from an oversold area initiated the bullish price action for the index. Earlier, the 38.2% retracement level was the immediate target for $INDU. The volume was highly encouraging till the first retracement level was converted to the support. But as the rally continued to surge towards the 50% level, volume shrank. A doji and bullish candle between the two retracement levels in Figure 1 reflect the hesitation among traders. However, an increasing bullish pressure pulled the index to its second target, which is the 50% retracement level. The 40-day moving average and the 61.8% retracement level coincide approximately at the same level of 11,200/11,226, respectively. Therefore, these levels are the long-term target for $INDU. |

|
| FIGURE 1: $INDU, MONTHLY. The 40-day MA and the 61.8% Fibonacci retracement level are the robust resistance and the long-term target for the index. Since the 40-day MA would fluctuate according to price movement, it may suppress the rally before hitting the retracement level. |
| Graphic provided by: StockCharts.com. |
| |
| The stochastic (14,3,3) has surged above the 50 level, indicating bullish momentum in the rally. In addition, the moving average convergence/divergence (MACD) (12,26,9) is showing a bullish crossover, reconfirming the positive momentum. Although the index remains in the developing downtrend zone, the ADX (14) is descending along with selling pressure. Meanwhile, an increasing buying pressure would develop a fresh bullish sentiment. Therefore, the 61.8% level would be an achievable target with a long-term perspective. |

|
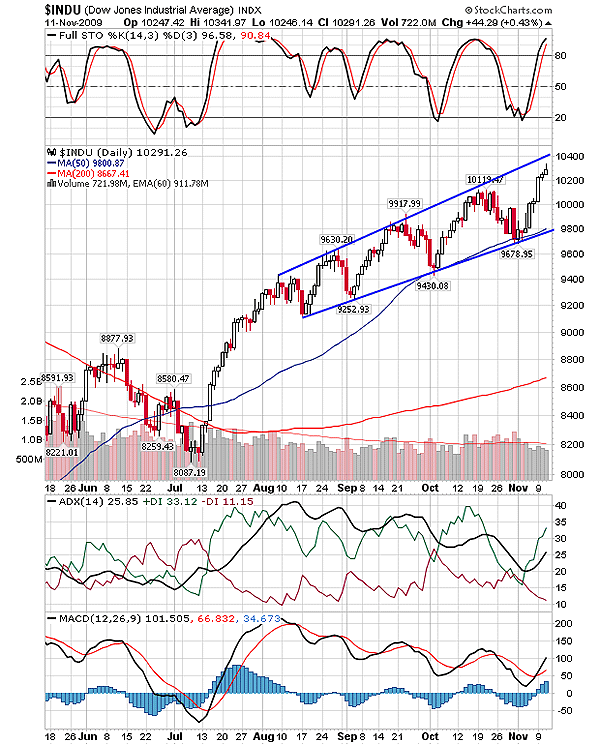
| FIGURE 2: $INDU, DAILY. The upper trendline resistance is the short-term target for the index. |
| Graphic provided by: StockCharts.com. |
| |
| The daily time frame would show short-term supports and resistances for $INDU. In Figure 2, the channel is drawn joining the higher highs and higher lows. The channel is widening at the tail, therefore, the formation is not a rising wedge and neither is it an expanding channel. The expanding channel is formed by the upper and lower trendlines diverging in two different directions. Although the channel in Figure 2 is broader at the tail, both trendlines are ascending with marginal divergences. Therefore, we would consider the upper trendline as the resistance line or the future target for $INDU and the lower trendline would be the strong support during the correction. The support of the 50-day MA and the lower trendline was challenged twice. The recent rally from the 9678 level seems to be exhausted as the size of the bullish candlesticks has shrunk. The index is approaching the next target of an ascending upper trendline near 10,400. The developing uptrend and the healthily overbought stochastic are indications that the index could reach its immediate target. The shaky MACD (12,26,9) indicates volatility in the rally. |
| Thus, the Fibonacci retracement level, the moving averages, and the trendlines highlight the potential target of $INDU for the short-term and long-term view. |
Active trader in the Indian stock markets since 2003 and a full-time writer. Trading is largely based upon technical analysis.
| Company: | Independent |
| Address: | C1/3 Parth Indraprasth Towers. Vastrapur |
| Ahmedabad, Guj 380015 | |
| E-mail address: | chaitalimohile@yahoo.co.in |
Traders' Resource Links | |
| Independent has not added any product or service information to TRADERS' RESOURCE. | |
Click here for more information about our publications!
PRINT THIS ARTICLE

Request Information From Our Sponsors
- StockCharts.com, Inc.
- Candle Patterns
- Candlestick Charting Explained
- Intermarket Technical Analysis
- John Murphy on Chart Analysis
- John Murphy's Chart Pattern Recognition
- John Murphy's Market Message
- MurphyExplainsMarketAnalysis-Intermarket Analysis
- MurphyExplainsMarketAnalysis-Visual Analysis
- StockCharts.com
- Technical Analysis of the Financial Markets
- The Visual Investor
- VectorVest, Inc.
- Executive Premier Workshop
- One-Day Options Course
- OptionsPro
- Retirement Income Workshop
- Sure-Fire Trading Systems (VectorVest, Inc.)
- Trading as a Business Workshop
- VectorVest 7 EOD
- VectorVest 7 RealTime/IntraDay
- VectorVest AutoTester
- VectorVest Educational Services
- VectorVest OnLine
- VectorVest Options Analyzer
- VectorVest ProGraphics v6.0
- VectorVest ProTrader 7
- VectorVest RealTime Derby Tool
- VectorVest Simulator
- VectorVest Variator
- VectorVest Watchdog
