HOT TOPICS LIST
- MACD
- Fibonacci
- RSI
- Gann
- ADXR
- Stochastics
- Volume
- Triangles
- Futures
- Cycles
- Volatility
- ZIGZAG
- MESA
- Retracement
- Aroon
INDICATORS LIST
LIST OF TOPICS
PRINT THIS ARTICLE
by Koos van der Merwe
The bankruptcy of General Motors, and the financial difficulty the motor vehicle industry has found itself in, has scared the market. But is it time to invest in it?
Position: Buy
Koos van der Merwe
Has been a technical analyst since 1969, and has worked as a futures and options trader with First Financial Futures in Johannesburg, South Africa.
PRINT THIS ARTICLE
CUP WITH HANDLE
Too Big To Fail?
11/11/09 08:39:57 AMby Koos van der Merwe
The bankruptcy of General Motors, and the financial difficulty the motor vehicle industry has found itself in, has scared the market. But is it time to invest in it?
Position: Buy
| Throughout the United States, too many companies supply parts to the major motor vehicle factories, and they provide employment to too many Americans. The phrase "too big to fail" therefore does not only apply to the banks and insurance companies that are now being broken up into smaller entities, but also to the motor vehicle industry, something we are inclined to forget. The industry is broken up into smaller companies; the problem, however, is that the smaller companies have only one outlet for their product, the motor vehicle industry. ArvinMeritor, Inc., is one of those companies. They are a premier global supplier of a broad range of integrated systems, modules, and components to the motor vehicle industry. The company serves commercial truck, trailer, and specialty original equipment manufacturers (OEMs) and certain aftermarkets, and light vehicle manufacturers. There are 114 locations in 27 countries on five continents and they employ approximately 19,800 employees. |

|
| FIGURE 1: ARVINMERITOR, WEEKLY |
| Graphic provided by: AdvancedGET. |
| |
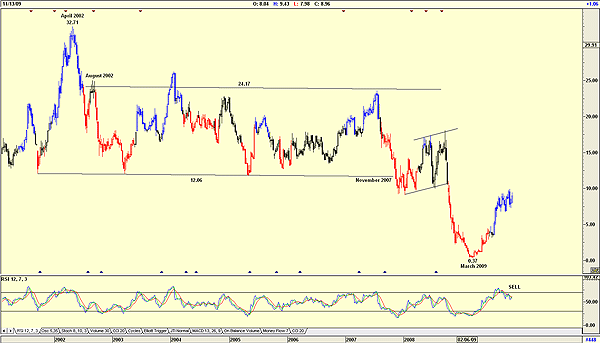
| Figure 1 shows how the share price has fallen from a high of $32.71 in April 2002 to a low of 37 cents by March 2009. The chart does show how the share price traded in the range of $12.06 to $24.17 between August 2002 to November 2007. The question now is, as the market recovers and the economy starts strengthening, is it worth owning ArvinMeritor at the present price or should we wait? To answer this question, you must decide whether your view is long term or short term. Long term says no, leave it alone, because the relative strength index (RSI) is suggesting a sell signal. For the short term, however, I look at my daily chart in Figure 2. |

|
| FIGURE 2: ARVINMERITOR, DAILY |
| Graphic provided by: OmniTrader. |
| |
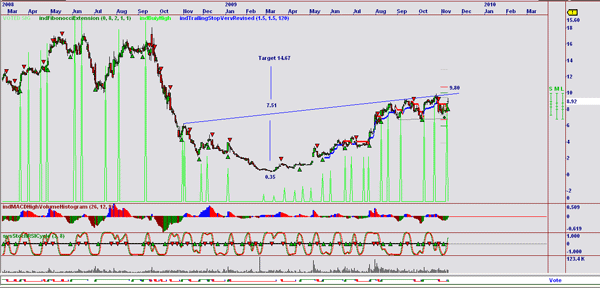
| Figure 2 is an OmniTrader chart and shows the following: a. The cup & handle formation, suggesting that should the price break above $9.80, the target will be $14.67. b. The green arrow lines that trigger a buy signal when the price rises above the high of four days ago. This indicator has given a buy signal and the present level. c. The moving average convergence/divergence (MACD) of the high, including volume, which has given a buy signal at present levels. d. The stochastic RSI, which has also given a buy signal. e. Volume has, however, been average. f. Finally, if you look at the trendlines on the chart, you will note that the formation of the handle is a trumpet formation, which means that the price could go any way, but the vote line of the chart has given a buy signal after the sell signal was stopped out. ArvinMeritor is a share I would buy at present levels. Long-term cautious investors could wait for a breakout above $9.80. |
Has been a technical analyst since 1969, and has worked as a futures and options trader with First Financial Futures in Johannesburg, South Africa.
| Address: | 3256 West 24th Ave |
| Vancouver, BC | |
| Phone # for sales: | 6042634214 |
| E-mail address: | petroosp@gmail.com |
Click here for more information about our publications!
Comments
Date: 11/13/09Rank: 3Comment:

Request Information From Our Sponsors
- StockCharts.com, Inc.
- Candle Patterns
- Candlestick Charting Explained
- Intermarket Technical Analysis
- John Murphy on Chart Analysis
- John Murphy's Chart Pattern Recognition
- John Murphy's Market Message
- MurphyExplainsMarketAnalysis-Intermarket Analysis
- MurphyExplainsMarketAnalysis-Visual Analysis
- StockCharts.com
- Technical Analysis of the Financial Markets
- The Visual Investor
- VectorVest, Inc.
- Executive Premier Workshop
- One-Day Options Course
- OptionsPro
- Retirement Income Workshop
- Sure-Fire Trading Systems (VectorVest, Inc.)
- Trading as a Business Workshop
- VectorVest 7 EOD
- VectorVest 7 RealTime/IntraDay
- VectorVest AutoTester
- VectorVest Educational Services
- VectorVest OnLine
- VectorVest Options Analyzer
- VectorVest ProGraphics v6.0
- VectorVest ProTrader 7
- VectorVest RealTime Derby Tool
- VectorVest Simulator
- VectorVest Variator
- VectorVest Watchdog
