HOT TOPICS LIST
- MACD
- Fibonacci
- RSI
- Gann
- ADXR
- Stochastics
- Volume
- Triangles
- Futures
- Cycles
- Volatility
- ZIGZAG
- MESA
- Retracement
- Aroon
INDICATORS LIST
LIST OF TOPICS
PRINT THIS ARTICLE
by Donald W. Pendergast, Jr.
Now that the anticipated B wave higher has drawn new buyers into the broad market fray, selling out-of-the-money calls might be just the ticket.
Position: Sell
Donald W. Pendergast, Jr.
Donald W. Pendergast is a financial markets consultant who offers specialized services to stock brokers and high net worth individuals who seek a better bottom line for their portfolios.
PRINT THIS ARTICLE
SUPPORT & RESISTANCE
TNA Resistance Zone Invites Call Sales
11/10/09 08:46:18 AMby Donald W. Pendergast, Jr.
Now that the anticipated B wave higher has drawn new buyers into the broad market fray, selling out-of-the-money calls might be just the ticket.
Position: Sell
| You just gotta love the short attention span of most market players. The Standard & Poor's 500 and Russell 2000 indexes make a predictable B wave, a bullish bounce in the wake of a significant trend reversal, and all of a sudden it's as if the recent market rout never even happened. But then, that's what makes all markets tick — different expectations from different groups of traders, each convinced that they are on the side that the market will ultimately favor. Unfortunately for the bulls, the market is very likely to peak soon as this fake bullish swing begins to falter as it meets significant resistance. A further examination follows. |

|
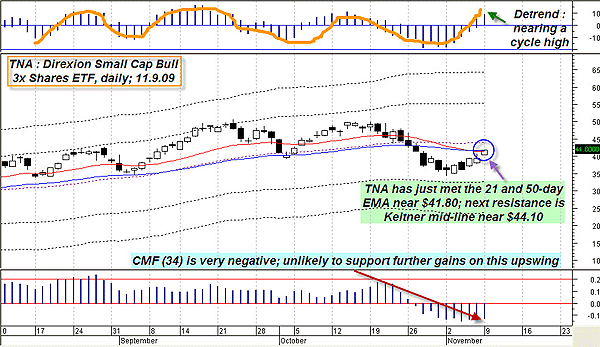
| FIGURE 1: TNA, DAILY. While the 21- and 50-period EMAs may help offer resistance, the real key that suggests TNA may reverse soon is the abysmally low Chaikin money flow (CMF)(34) reading. |
| Graphic provided by: MetaStock. |
| Graphic provided by: WB Detrend EOD from ProfitTrader for MetaStock. |
| |
| Figure 1 is the first daily chart, overlaid with a Keltner grid, a detrend oscillator, and a Chaikin money flow indicator (CMF)(34). In addition, the 21- (red line) and 50-day (blue line) exponential moving averages (EMA) are also included. TNA has risen sharply out of the early November hole it crashed into, and this is likely the B corrective wave often seen in the wake of a major trend reversal. Typically, the B wave will retrace a portion of the A wave decline before turning lower into a powerful C wave that will attempt to meet or even exceed the swing low price achieved by the A wave. Since the B wave is now beginning to meet a bevy of strong resistance levels, we need to be prepared for the market to stall and turn lower within the next few sessions. TNA is now right up against its 21- and 50-day EMA; the 50-day EMA is usually a very strong resistance level in situations like this, and since the detrend oscillator (top of chart) may also be hinting that a daily cycle top may be within sight, anyone holding long TNA, IWM, or Russell 2000 positions needs to be sure they have an exit strategy already in place. Even more ominous for bulls, the (CMF) (34) (bottom of chart) is well below its zero line, having hardly budged at all since the bounce began last week. Clearly, money is not flowing into this security, and as such, a sustained advance from here is highly unlikely, if not impossible. Now let's look at another chart for another view of the overhead resistance areas that are likely to hinder any further advance by TNA on this particular upswing. |

|
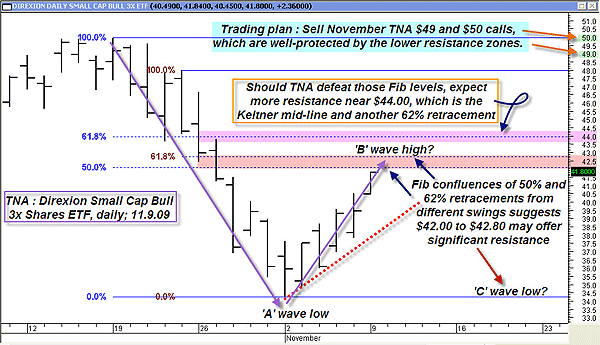
| FIGURE 2: TNA, DAILY. Vince Lombardi should be proud; doing a pregame strategy session with your charts can help you plan solid offensive and defensive strategies. In this case, our wide receivers (the short $49 and $50 calls) are provided ample protection from defensive linebackers at the $42, $44, and $48 yard lines, respectively. |
| Graphic provided by: MetaStock. |
| |
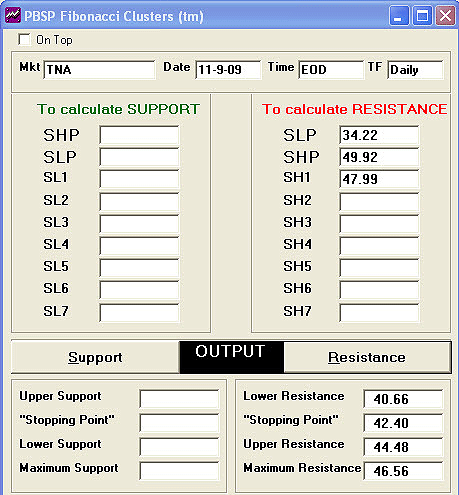
| Two separate Fibonacci retracement grids are overlaid on this daily TNA chart (Figure 2); the stock is just shy of the lower boundary of a Fibonacci confluence zone (red shaded area) that ranges from $42 to $42.80. Unless something unusual happens, this is the most likely price area in which to expect TNA's current B wave to stall out. Even if that Fibonacci confluence area is taken out, the area near $44 also features yet another Fibonacci 62% retracement and the Keltner band midline, which is based on a 45-period EMA. The Keltner midline is an exceptionally strong support/resistance (S/R) area in many stocks, indexes, and futures contracts, and it also appears to do a fine job on TNA of defining key S/R levels (see Figure 3). With so many resistance areas for TNA to contend with, is there a simple fairly low-risk option play that we can utilize to add some cash to our trading accounts? I believe there is. |

|
| FIGURE 3: FIBONACCI CLUSTERS. Various kinds of trading software can help you more easily pinpoint prime areas of Fibonacci support and resistance. |
| Graphic provided by: PBSP Fibonacci clusters calculator. |
| |
| Right now, implied and historical volatility levels are still way above average for TNA, although it has begun to decline somewhat. Nevertheless, option premiums are still very attractive. So, given that TNA has so many resistance levels to overcome before it can even hit $44.50, why not sell either a November TNA $49 call option or a November TNA $50 call option? Both options feature tiny deltas and they also sport very attractive theta-to-vega ratios of 4:1, which means that increases in implied volatility are more than offset by the massive amounts of time decay (more than $4 per day at present) offered by either option. Best of all, the premiums offered are still decent for options that are so far out-of-the-money. The $49 call (TIJKP) might fetch as much as $0.30 on a minor bounce higher at tomorrow's open, while the $50 call (TIJKJ) might garner about $0.20. Now, those might seem to be tiny premiums, but who says you only need to sell one or two of them? If you employ strict risk control and your trading account is large enough, you could always sell five or even 10 of them, being sure to buy back any option that doubles in price. The $49 call has only a 13% chance of going in the money by November 20, 2009, while the $50 call has less than a 11% chance of doing so. With so many technical dynamics working in favor of such short-term option sales, see if this method of generating income for your trading account doesn't make perfect sense. |
Donald W. Pendergast is a financial markets consultant who offers specialized services to stock brokers and high net worth individuals who seek a better bottom line for their portfolios.
| Title: | Writer, market consultant |
| Company: | Linear Trading Systems LLC |
| Jacksonville, FL 32217 | |
| Phone # for sales: | 904-239-9564 |
| E-mail address: | lineartradingsys@gmail.com |
Traders' Resource Links | |
| Linear Trading Systems LLC has not added any product or service information to TRADERS' RESOURCE. | |
Click here for more information about our publications!
PRINT THIS ARTICLE

Request Information From Our Sponsors
- StockCharts.com, Inc.
- Candle Patterns
- Candlestick Charting Explained
- Intermarket Technical Analysis
- John Murphy on Chart Analysis
- John Murphy's Chart Pattern Recognition
- John Murphy's Market Message
- MurphyExplainsMarketAnalysis-Intermarket Analysis
- MurphyExplainsMarketAnalysis-Visual Analysis
- StockCharts.com
- Technical Analysis of the Financial Markets
- The Visual Investor
- VectorVest, Inc.
- Executive Premier Workshop
- One-Day Options Course
- OptionsPro
- Retirement Income Workshop
- Sure-Fire Trading Systems (VectorVest, Inc.)
- Trading as a Business Workshop
- VectorVest 7 EOD
- VectorVest 7 RealTime/IntraDay
- VectorVest AutoTester
- VectorVest Educational Services
- VectorVest OnLine
- VectorVest Options Analyzer
- VectorVest ProGraphics v6.0
- VectorVest ProTrader 7
- VectorVest RealTime Derby Tool
- VectorVest Simulator
- VectorVest Variator
- VectorVest Watchdog
