HOT TOPICS LIST
- MACD
- Fibonacci
- RSI
- Gann
- ADXR
- Stochastics
- Volume
- Triangles
- Futures
- Cycles
- Volatility
- ZIGZAG
- MESA
- Retracement
- Aroon
INDICATORS LIST
LIST OF TOPICS
PRINT THIS ARTICLE
by Mike Carr, CMT
Stock indexes are testing trendlines, and the result of that test is likely to be significant.
Position: N/A
Mike Carr, CMT
Mike Carr, CMT, is a member of the Market Technicians Association, and editor of the MTA's newsletter, Technically Speaking. He is also the author of "Smarter Investing in Any Economy: The Definitive Guide to Relative Strength Investing," and "Conquering the Divide: How to Use Economic Indicators to Catch Stock Market Trends."
PRINT THIS ARTICLE
STRATEGIES
Simple Trendlines Say "Pay Attention"
11/09/09 09:30:42 AMby Mike Carr, CMT
Stock indexes are testing trendlines, and the result of that test is likely to be significant.
Position: N/A
| Trendlines are easy to draw — find a low and draw a line that touches a subsequent low. In downtrends, the opposite is done as highs are connected with the line. While trendlines are widely used by technical analysts, it is important to remember that they are best used as approximate tools. They should be drawn widely and small breaks should be treated as warnings rather than trade signals. |
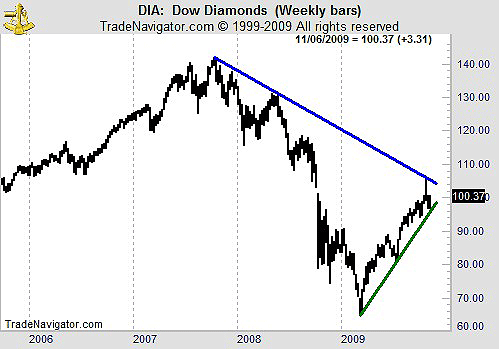
| In the Dow Jones Industrial Average (DJIA)(Figure 1), prices are holding above a trendline drawn from the March 2009 bottom. A trendline from the October 2007 stopped prices in late October of this year and may offer resistance in the future. |

|
| FIGURE 1: DJIA, WEEKLY. Weekly prices are nearing a critical juncture as two trendlines converge. |
| Graphic provided by: Trade Navigator. |
| |
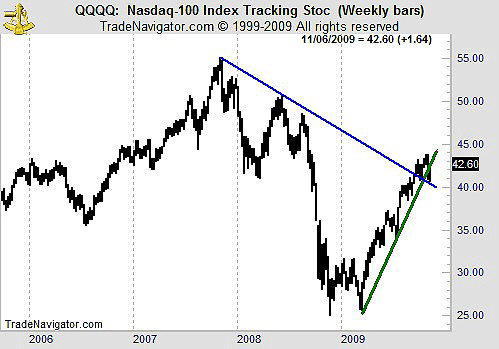
| In the NASDAQ 100 (Figure 2), prices broke above the long-term downtrend line and are now trading below the uptrend line. Again, we face a critical level and will shortly see how this resolves. |

|
| FIGURE 2: NASDAQ 100, WEEKLY. The weekly chart of the NASDAQ 100 is below the uptrend, and challenging that line. It is common for prices to have a false breakout, in this case downward, before resuming an uptrend. |
| Graphic provided by: Trade Navigator. |
| |
| We see similar trendlines in the Standard & Poor's 500. Weekly charts show that prices are in a precarious position. How this is resolved will likely reveal the longer-term trend to traders over the next few weeks. |
Mike Carr, CMT, is a member of the Market Technicians Association, and editor of the MTA's newsletter, Technically Speaking. He is also the author of "Smarter Investing in Any Economy: The Definitive Guide to Relative Strength Investing," and "Conquering the Divide: How to Use Economic Indicators to Catch Stock Market Trends."
| Website: | www.moneynews.com/blogs/MichaelCarr/id-73 |
| E-mail address: | marketstrategist@gmail.com |
Click here for more information about our publications!
Comments
Date: 11/10/09Rank: 4Comment:
Date: 11/10/09Rank: 5Comment:

Request Information From Our Sponsors
- VectorVest, Inc.
- Executive Premier Workshop
- One-Day Options Course
- OptionsPro
- Retirement Income Workshop
- Sure-Fire Trading Systems (VectorVest, Inc.)
- Trading as a Business Workshop
- VectorVest 7 EOD
- VectorVest 7 RealTime/IntraDay
- VectorVest AutoTester
- VectorVest Educational Services
- VectorVest OnLine
- VectorVest Options Analyzer
- VectorVest ProGraphics v6.0
- VectorVest ProTrader 7
- VectorVest RealTime Derby Tool
- VectorVest Simulator
- VectorVest Variator
- VectorVest Watchdog
- StockCharts.com, Inc.
- Candle Patterns
- Candlestick Charting Explained
- Intermarket Technical Analysis
- John Murphy on Chart Analysis
- John Murphy's Chart Pattern Recognition
- John Murphy's Market Message
- MurphyExplainsMarketAnalysis-Intermarket Analysis
- MurphyExplainsMarketAnalysis-Visual Analysis
- StockCharts.com
- Technical Analysis of the Financial Markets
- The Visual Investor
