HOT TOPICS LIST
- MACD
- Fibonacci
- RSI
- Gann
- ADXR
- Stochastics
- Volume
- Triangles
- Futures
- Cycles
- Volatility
- ZIGZAG
- MESA
- Retracement
- Aroon
INDICATORS LIST
LIST OF TOPICS
PRINT THIS ARTICLE
by Chaitali Mohile
How far would the US Dollar Index descend?
Position: N/A
Chaitali Mohile
Active trader in the Indian stock markets since 2003 and a full-time writer. Trading is largely based upon technical analysis.
PRINT THIS ARTICLE
CHART ANALYSIS
Is The US Dollar Likely To Weaken Further?
11/09/09 11:59:00 AMby Chaitali Mohile
How far would the US Dollar Index descend?
Position: N/A
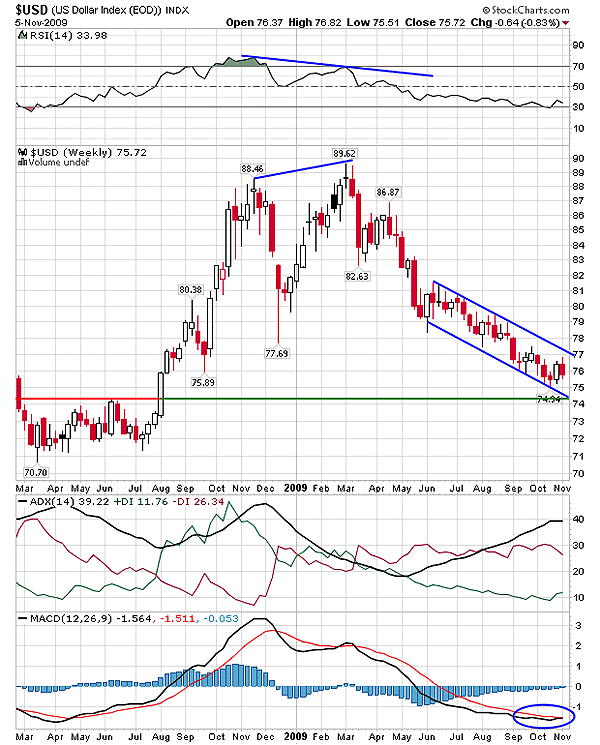
| The US Dollar Index ($USD) formed a double top -- a bearish reversal formation in November 2008 and March 2009. The first peak was formed at 88.46 and the second was marginally higher at 89.62 levels. The formation indicates the topping-out situation and suggests the possibility of a fresh down move. By the time the second top was built, the relative strength index (RSI) (14) had already started its downward journey (see Figure 1). The descending rally of the RSI (14) reflected the lessening bullish strength. The average directional movement index (ADX) (14) had shifted in an uptrend area for a few months, dropped from an overheated region above 40 levels. An intermediate uptrend reversed by May 2009 as $USD formed lower lows and witnessed a steep fall. |

|
| FIGURE 1: $USD, WEEKLY. The support-resistance tool line shows the extreme support zone for the current descending rally. |
| Graphic provided by: StockCharts.com. |
| |
| In Figure 1 the descending channel showed the baby steps taken by $USD toward its lowest support at 74.94 levels. An upper range of the bottom consolidation in 2008 developed the support for the current bearish rally. The index has moved nearer to the support line. The support-resistance tool line would be the ultimate support for the current descending rally. The moving average convergence/divergence (MACD) (12,26,9) has moved closer to the trigger line in negative territory, suggesting a bullish crossover. The crossover would bring a fresh bullish wave that would pull the index marginally higher. In addition, the downtrend would soon be overheated if the ADX (14) touched 40 levels or above. In that case, the bearish rally would slow down. |
| This scenario would give birth to the bullish sessions within the descending channel. Currently, the RSI (14) shows lack of bullish strength and is moving with the support of 30 levels. Hence, an upward breakout of the descending channel looks difficult. In fact, $USD is more likely to challenge the lowest support indicated by the support-resistance tool in Figure 1. Therefore, the index is likely to weaken for few more sessions. This also means that the Dow Jones Industrial Average (DJIA) would see healthy bullish days very soon. |
Active trader in the Indian stock markets since 2003 and a full-time writer. Trading is largely based upon technical analysis.
| Company: | Independent |
| Address: | C1/3 Parth Indraprasth Towers. Vastrapur |
| Ahmedabad, Guj 380015 | |
| E-mail address: | chaitalimohile@yahoo.co.in |
Traders' Resource Links | |
| Independent has not added any product or service information to TRADERS' RESOURCE. | |
Click here for more information about our publications!
Comments
Date: 11/10/09Rank: 5Comment:

Request Information From Our Sponsors
- StockCharts.com, Inc.
- Candle Patterns
- Candlestick Charting Explained
- Intermarket Technical Analysis
- John Murphy on Chart Analysis
- John Murphy's Chart Pattern Recognition
- John Murphy's Market Message
- MurphyExplainsMarketAnalysis-Intermarket Analysis
- MurphyExplainsMarketAnalysis-Visual Analysis
- StockCharts.com
- Technical Analysis of the Financial Markets
- The Visual Investor
- VectorVest, Inc.
- Executive Premier Workshop
- One-Day Options Course
- OptionsPro
- Retirement Income Workshop
- Sure-Fire Trading Systems (VectorVest, Inc.)
- Trading as a Business Workshop
- VectorVest 7 EOD
- VectorVest 7 RealTime/IntraDay
- VectorVest AutoTester
- VectorVest Educational Services
- VectorVest OnLine
- VectorVest Options Analyzer
- VectorVest ProGraphics v6.0
- VectorVest ProTrader 7
- VectorVest RealTime Derby Tool
- VectorVest Simulator
- VectorVest Variator
- VectorVest Watchdog
