HOT TOPICS LIST
- MACD
- Fibonacci
- RSI
- Gann
- ADXR
- Stochastics
- Volume
- Triangles
- Futures
- Cycles
- Volatility
- ZIGZAG
- MESA
- Retracement
- Aroon
INDICATORS LIST
LIST OF TOPICS
PRINT THIS ARTICLE
by Chaitali Mohile
The Airlines Index has been correcting since mid-September. The short-term moving average support converted to resistance. Will the index continue the bearish rally and remain an underperformer?
Position: N/A
Chaitali Mohile
Active trader in the Indian stock markets since 2003 and a full-time writer. Trading is largely based upon technical analysis.
PRINT THIS ARTICLE
MOVING AVERAGES
Airlines Index Remains An Underperformer
11/06/09 11:55:35 AMby Chaitali Mohile
The Airlines Index has been correcting since mid-September. The short-term moving average support converted to resistance. Will the index continue the bearish rally and remain an underperformer?
Position: N/A
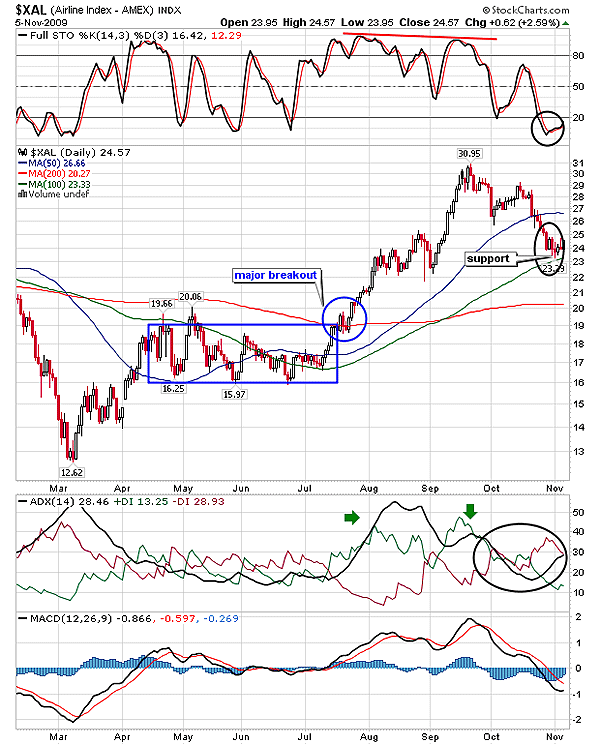
| Increasing bearish pressure in the global financial markets has developed to identify more support and resistance for the declining rally. Accordingly, I have added a 100-day moving average (MA) on the daily as well as weekly time frame of the Airlines Index ($XAL). The recovery in $XAL began in March 2009. During the relief rally, $XAL turned highly volatile as it approached three MA resistances, that is, 50, 100-, and 200-day MAs. The blue rectangle in Figure 1 shows that after converting 50-day MA resistance to support, $XAL tried to breach the 100-day MA resistance as well. The index challenged the same MA resistance twice but failed and retraced below the 50-day MA support. However, an increasing buying pressure helped $XAL to surge above the converging 50- and 100-day MA resistances. The average directional movement index (ADX) (14) moved in favor of bulls, and thus, the index violated the robust 200-day MA resistance. This MA breakout was the first bullish indication in Figure 1 that generated positive sentiment toward the fresh rally. |
| The breakout rally reached a high of $30.95 but the full stochastic (14,3,3) made a lower high, forming a negative divergence. The divergence weakened the bullish rally and dragged $XAL lower. Due to the huge selling pressure, the index dropped below the short-term moving average, a 50-day MA. An overheated ADX (14) in August was one more reason for the decline. The descending uptrend from an overheated level weakened the bullish rally, and as a result, the index gradually lost the previous gains. In addition, breaching the 50-day MA support is also an intermediate bearish indication. |

|
| FIGURE 1: $XAL, DAILY. The index has touched the 100-day MA support. The oversold stochastic is ready to turn upward and help $XAL to surge. But the developing downtrend is likely to pour volatility in the bullish rally. |
| Graphic provided by: StockCharts.com. |
| |
| The stochastic oscillator formed a lower high and took a nosedive into an oversold region. Recently, $XAL has established support at the 100-day MA. The ADX (14) is indicating a developing downtrend, and the moving average convergence/divergence (MACD) (12,26,9) has slipped marginally in negative territory. Due to these mixed indications, $XAL is likely to consolidate with the support of the 100-day MA. But I would request traders to stay alert and be watchful as the bears are likely to get stronger. We need to see if the index moves within the 50- and 100-day MA range or slips below the 100-day MA support. |

|
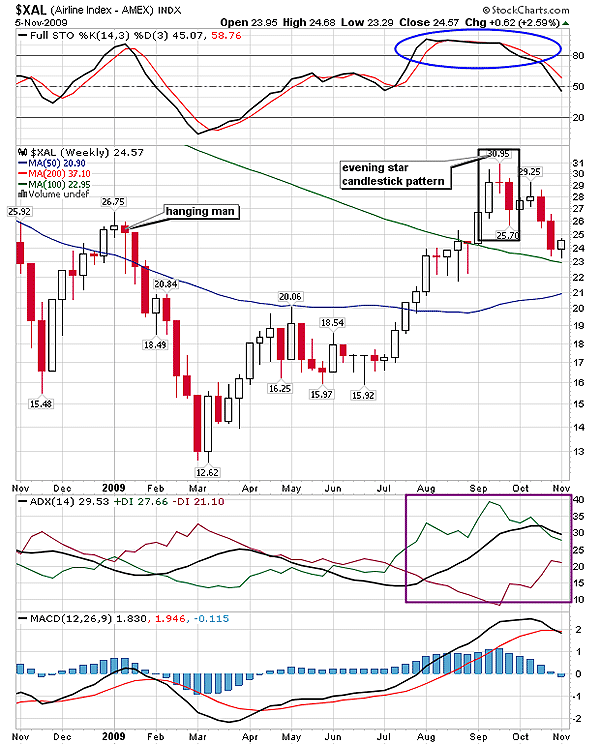
| FIGURE 2: $XAL, WEEKLY. The chart shows two bearish reversal candlestick patterns, the hanging man and an evening star formation. |
| Graphic provided by: StockCharts.com. |
| |
| In early 2009, $XAL formed a hanging man candlestick pattern on the weekly time frame in Figure 2. This pattern is a bearish reversal pattern, suggesting a fresh bearish rally. We can see the index lost nearly 12 points after the candlestick pattern. The hanging man was confirmed by the declining stochastic from an overbought area. One reversal candlestick pattern resulted in a small correction in 2009. The other reversal candlestick pattern that formed in September was stronger than the previous one. An evening star candlestick pattern shown on the chart is a cluster of three candles; first is a bullish candle, indicating an existing uptrend, followed by a doji, and the third bearish candle reflects a new trend. The stochastic oscillator that moved flat in an overbought region drifted down, the developed uptrend turned down, and the positive MACD (12,26,9) declined, suggesting the possibility of a bearish crossover. Thus, the evening star candlestick was confirmed by the reversing indicators. |
| The 100-day MA offered strong support to the bearish rally of $XAL. All the three indicators are still bullish, and hence, the index is likely to establish support at the 100-day MA. $XAL has been an underperformer for the past few years. But if the index fails to establish the support, the bearish rally would continue. |
Active trader in the Indian stock markets since 2003 and a full-time writer. Trading is largely based upon technical analysis.
| Company: | Independent |
| Address: | C1/3 Parth Indraprasth Towers. Vastrapur |
| Ahmedabad, Guj 380015 | |
| E-mail address: | chaitalimohile@yahoo.co.in |
Traders' Resource Links | |
| Independent has not added any product or service information to TRADERS' RESOURCE. | |
Click here for more information about our publications!
PRINT THIS ARTICLE

Request Information From Our Sponsors
- StockCharts.com, Inc.
- Candle Patterns
- Candlestick Charting Explained
- Intermarket Technical Analysis
- John Murphy on Chart Analysis
- John Murphy's Chart Pattern Recognition
- John Murphy's Market Message
- MurphyExplainsMarketAnalysis-Intermarket Analysis
- MurphyExplainsMarketAnalysis-Visual Analysis
- StockCharts.com
- Technical Analysis of the Financial Markets
- The Visual Investor
- VectorVest, Inc.
- Executive Premier Workshop
- One-Day Options Course
- OptionsPro
- Retirement Income Workshop
- Sure-Fire Trading Systems (VectorVest, Inc.)
- Trading as a Business Workshop
- VectorVest 7 EOD
- VectorVest 7 RealTime/IntraDay
- VectorVest AutoTester
- VectorVest Educational Services
- VectorVest OnLine
- VectorVest Options Analyzer
- VectorVest ProGraphics v6.0
- VectorVest ProTrader 7
- VectorVest RealTime Derby Tool
- VectorVest Simulator
- VectorVest Variator
- VectorVest Watchdog
