HOT TOPICS LIST
- MACD
- Fibonacci
- RSI
- Gann
- ADXR
- Stochastics
- Volume
- Triangles
- Futures
- Cycles
- Volatility
- ZIGZAG
- MESA
- Retracement
- Aroon
INDICATORS LIST
LIST OF TOPICS
PRINT THIS ARTICLE
by Koos van der Merwe
Morgan Stanley Emerging Markets Debt Fund operates as a nondiversified, closed-end management investment company. Is it worth a look?
Position: Buy
Koos van der Merwe
Has been a technical analyst since 1969, and has worked as a futures and options trader with First Financial Futures in Johannesburg, South Africa.
PRINT THIS ARTICLE
MACD
Morgan Stanley Emerging Market Debt A Buy?
11/06/09 11:15:29 AMby Koos van der Merwe
Morgan Stanley Emerging Markets Debt Fund operates as a nondiversified, closed-end management investment company. Is it worth a look?
Position: Buy
| The fund invests primarily in debt securities that include investments in energy, industrial, short-term investments, sovereign, and other sectors. Morgan Stanley Investment Management serves as the investment advisor of the fund. Investors should take advantage of any dips in emerging-market bonds by adding to their holdings because global funds are likely to pump more money into the securities, or so says Morgan Stanley. Funds focusing on these assets have moderate risk levels against their benchmarks and the balance of demand and supply remains supportive of further price gains in the coming weeks. Developing nations' debt slumped in the past three weeks as concern about the strength of the global economy's recovery from a recession curbed risk-taking. Investors demanded a yield premium of 3.21 percentage points over US Treasuries to buy emerging-market sovereign debt. "The end of the year is traditionally favorable for fund inflows as strategic mandates are made," Morgan Stanley stated in a report. "Bouts of weakness, such as the one just experienced, are to be expected and should be bought into, with a view to further asset price gains into early next year." So are they correct? Would you buy the stock? What does the chart say? The yield as of this writing is 7.873%, not bad considering, and definitely meeting the 3.21 percentage points over US Treasuries. |

|
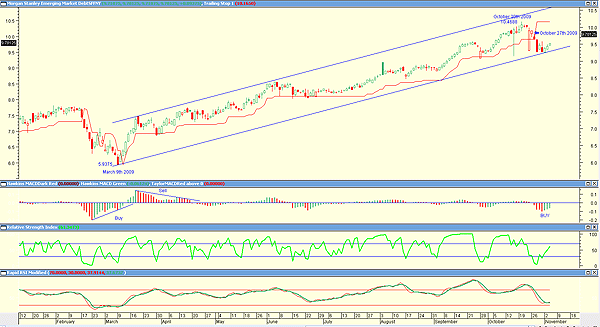
| FIGURE 1: MSD, DAILY |
| Graphic provided by: MetaStock. |
| |
| Figure 1 shows the following: -On March 9, 2009, the share price was $5.9375. The share price rose to $10.4688 by October 20. On that date, the share price fell, breaking through the trailing stop shown on the chart to test the support trendline. -The chart shows a trailing stop and the closing price broke below it on October 27. -My first indicator is called the Hawkins MACD volume indicator as presented by David Hawkins in the November 2009 issue of STOCKS & COMMODITIES. I have altered the formula to an MACD of the high, not close. I have designed the indicator so that a buy signal is given when the color of the histogram changes from red to green when below the zero line, and a sell signal from green to red and when above the zero line. I have also suggested that the indicator can be used as a divergence indicator. -My third indicator is the relative strength index (RSI) with a time period of 3. I use this indicator to confirm the signal given by the MACD volume indicator. -Finally, as a long-term indicator, I look at rapid RSI. The share is suggesting a buy at present levels with an attractive yield. |
Has been a technical analyst since 1969, and has worked as a futures and options trader with First Financial Futures in Johannesburg, South Africa.
| Address: | 3256 West 24th Ave |
| Vancouver, BC | |
| Phone # for sales: | 6042634214 |
| E-mail address: | petroosp@gmail.com |
Click here for more information about our publications!
Comments
Date: 11/10/09Rank: 5Comment: Koos:
Good article.
Cheers, Dick Slayton

Request Information From Our Sponsors
- StockCharts.com, Inc.
- Candle Patterns
- Candlestick Charting Explained
- Intermarket Technical Analysis
- John Murphy on Chart Analysis
- John Murphy's Chart Pattern Recognition
- John Murphy's Market Message
- MurphyExplainsMarketAnalysis-Intermarket Analysis
- MurphyExplainsMarketAnalysis-Visual Analysis
- StockCharts.com
- Technical Analysis of the Financial Markets
- The Visual Investor
- VectorVest, Inc.
- Executive Premier Workshop
- One-Day Options Course
- OptionsPro
- Retirement Income Workshop
- Sure-Fire Trading Systems (VectorVest, Inc.)
- Trading as a Business Workshop
- VectorVest 7 EOD
- VectorVest 7 RealTime/IntraDay
- VectorVest AutoTester
- VectorVest Educational Services
- VectorVest OnLine
- VectorVest Options Analyzer
- VectorVest ProGraphics v6.0
- VectorVest ProTrader 7
- VectorVest RealTime Derby Tool
- VectorVest Simulator
- VectorVest Variator
- VectorVest Watchdog
