HOT TOPICS LIST
- MACD
- Fibonacci
- RSI
- Gann
- ADXR
- Stochastics
- Volume
- Triangles
- Futures
- Cycles
- Volatility
- ZIGZAG
- MESA
- Retracement
- Aroon
INDICATORS LIST
LIST OF TOPICS
PRINT THIS ARTICLE
by David Penn
A big volume breakdown in live cattle futures turns a consolidation into a bearish continuation.
Position: N/A
David Penn
Technical Writer for Technical Analysis of STOCKS & COMMODITIES magazine, Working-Money.com, and Traders.com Advantage.
PRINT THIS ARTICLE
CHART ANALYSIS
Cattle's Diamond Continuation
11/09/01 12:35:00 PMby David Penn
A big volume breakdown in live cattle futures turns a consolidation into a bearish continuation.
Position: N/A
| Writing in his "Trading Commodity Futures with Classical Chart Patterns," Peter Lewis Brandt said of diamond patterns: "Diamonds are quite rare. If, as a trader, you see lots of diamonds, you have a case of diamonditis, a deadly chartist disease." |
| Just what constitutes "lots of diamonds" is pretty subjective. It is true that diamond patterns have, at times, had spotty performance records. The year-long diamond pattern in the Dow Industrials--from spring 1999 to spring 2000--did mark a top, although the breakdown from the diamond pattern in the fall of 2001 came after a failed breakdown earlier that spring. Thomas Bulkowski, in his "Encyclopedia of Chart Patterns," is not particularly sanguine about diamond tops, and the behavior of the Dow diamond may help explain the reason why. |

|
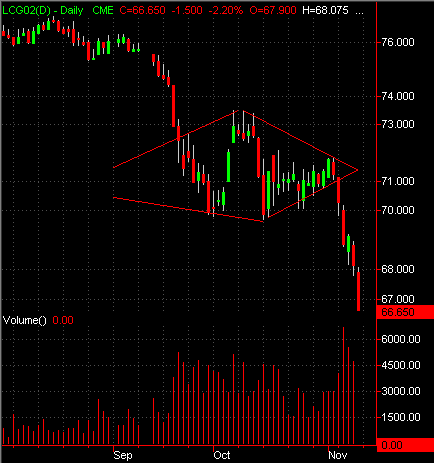
| Prices fall in and prices fall out ... Neither top nor bottom, this diamond pattern acts as a continuation of the downward trend. |
| Graphic provided by: TradeStation. |
| |
| However, after encountering a diamond continuation during the downtrend in January lumber ("January Lumber's Diamond Continuation", Traders.com, Oct. 18), I have been more sensitive to diamonds acting less as tops and bottoms and more as continuations. Within the pattern, the highs and lows of the diamond continuation help clearly establish points of support and resistance, perhaps making breakdowns and breakouts more distinct and convincing. |
| February live cattle (LCG2) fell out of a thin, downwardly slanted consolidation range early in September--joining a wide and diverse range of tradables that suffered declines in the wake of the September 11th terrorist attacks in the United States. Cattle reached a bottom of about 70 by late September, marking a significant point of support as the futures rallied going into October. The October rally in cattle peaked at about 73, with a trio of shooting star-like candlesticks that, in and of themselves, hinted at the rally's end. Prices did in fact retreat shortly thereafter, but support at 70 held. Cattle again attempted to rally, but after several days, the futures had only moved as high as 71--and on declining volume at that. |
| The two-day breakdown came at the beginning of November. On rising volume, February live cattle fell from 71 to 69. After a one-day rally (a three-day reversal, essentially), prices resumed their descent, reaching a low of 67. As of this writing, cattle futures were still moving down, reaching 66.7 in the afternoon of November 8th. This may be all there is to this particular downswing. The height of the diamond continuation pattern is about 3, from the resistance at 73 to the support area at 70 which, subtracted from the breakdown point of 71, provides for a minimum price target of 68. Again, with prices at 66.7, some short term consolidation for short-covering (for example) should be expected at these levels, whether or not prices move further south or attempt to stage a rally. |
Technical Writer for Technical Analysis of STOCKS & COMMODITIES magazine, Working-Money.com, and Traders.com Advantage.
| Title: | Technical Writer |
| Company: | Technical Analysis, Inc. |
| Address: | 4757 California Avenue SW |
| Seattle, WA 98116 | |
| Phone # for sales: | 206 938 0570 |
| Fax: | 206 938 1307 |
| Website: | www.Traders.com |
| E-mail address: | DPenn@traders.com |
Traders' Resource Links | |
| Charting the Stock Market: The Wyckoff Method -- Books | |
| Working-Money.com -- Online Trading Services | |
| Traders.com Advantage -- Online Trading Services | |
| Technical Analysis of Stocks & Commodities -- Publications and Newsletters | |
| Working Money, at Working-Money.com -- Publications and Newsletters | |
| Traders.com Advantage -- Publications and Newsletters | |
| Professional Traders Starter Kit -- Software | |
Click here for more information about our publications!
Comments
Date: 11/15/01Rank: 3Comment:

Request Information From Our Sponsors
- StockCharts.com, Inc.
- Candle Patterns
- Candlestick Charting Explained
- Intermarket Technical Analysis
- John Murphy on Chart Analysis
- John Murphy's Chart Pattern Recognition
- John Murphy's Market Message
- MurphyExplainsMarketAnalysis-Intermarket Analysis
- MurphyExplainsMarketAnalysis-Visual Analysis
- StockCharts.com
- Technical Analysis of the Financial Markets
- The Visual Investor
- VectorVest, Inc.
- Executive Premier Workshop
- One-Day Options Course
- OptionsPro
- Retirement Income Workshop
- Sure-Fire Trading Systems (VectorVest, Inc.)
- Trading as a Business Workshop
- VectorVest 7 EOD
- VectorVest 7 RealTime/IntraDay
- VectorVest AutoTester
- VectorVest Educational Services
- VectorVest OnLine
- VectorVest Options Analyzer
- VectorVest ProGraphics v6.0
- VectorVest ProTrader 7
- VectorVest RealTime Derby Tool
- VectorVest Simulator
- VectorVest Variator
- VectorVest Watchdog
